Last active
August 29, 2021 03:17
-
-
Save thistleknot/05c6dd68aca1e20a9586c08c0f564ba6 to your computer and use it in GitHub Desktop.
ECDF Python
This file contains bidirectional Unicode text that may be interpreted or compiled differently than what appears below. To review, open the file in an editor that reveals hidden Unicode characters.
Learn more about bidirectional Unicode characters
| converted = pd.DataFrame() | |
| def ecdf2(values): | |
| co = len(values) | |
| externalArray = pd.DataFrame() | |
| for d in range(0,len(values.columns)): | |
| internalArray = [] | |
| for i in range(0,len(values.iloc[:,d])): | |
| a = ( \ | |
| sum( ( values.iloc[:,d] <= values.iloc[:,d][i] ) ) + \ | |
| sum( ( values.iloc[:,d] < values.iloc[:,d][i] ) ) \ | |
| ) / 2 / co | |
| internalArray.append(a) | |
| externalArray = pd.concat([externalArray,pd.DataFrame(internalArray).round(2)],axis=1) | |
| return(externalArray) | |
| converted = ecdf2(X_pca) | |
| converted |
Sign up for free
to join this conversation on GitHub.
Already have an account?
Sign in to comment
and you'll get something like this
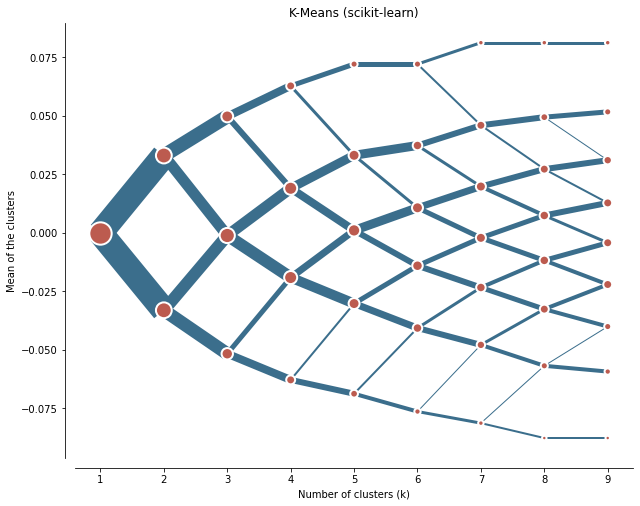
I got an exact 50/50 split on my a 2 k cluster but subsequent clusters begin to split off into different non symmetrical configurations.
To get an even split on k means using the above "converted"
Before running the above code you need PCA converted variables
then run above code
then run below to apply a PCA variance scale
and finally feed through clustergram with pca_weighted=false (we just applied it)