Last active
December 19, 2019 16:49
-
-
Save tim-salabim/ada72830faa2ec491e89f1dbfe32a115 to your computer and use it in GitHub Desktop.
This file contains bidirectional Unicode text that may be interpreted or compiled differently than what appears below. To review, open the file in an editor that reveals hidden Unicode characters.
Learn more about bidirectional Unicode characters
| library(raster) | |
| library(sf) | |
| library(sp) | |
| library(elevatr) | |
| library(mapview) | |
| library(magick) | |
| library(smoothr) | |
| library(RColorBrewer) | |
| # download from http://www.geodaten.bayern.de/opendata/Verwaltungsgebiete_shp_epsg31468.zip | |
| regbez = st_read("/home/timpanse/software/franconia_ele/Verwaltungsgebiete_shp_epsg31468/regbez_ex.shp") | |
| fran = regbez[regbez$BEZ_RBZ %in% franconia$district, ] | |
| fran = st_union(st_transform(fran, 4326)) | |
| fran = rmapshaper::ms_simplify(fran, keep = 0.05, keep_shapes = TRUE) | |
| fran = smooth(fran) | |
| fran = st_transform(fran, crs = 3035) | |
| ele = get_elev_raster(as(fran, "Spatial"), z = 9, src = "aws") | |
| mask = st_cast(fran, "MULTILINESTRING") | |
| mask = as(mask, "Spatial") | |
| ele = crop(ele, mask) | |
| ele = projectRaster(ele, crs = CRS("+init=epsg:3035")) | |
| ele = disaggregate(ele, fact = 5, method = "bilinear") | |
| tst = mask(ele, as(fran, "Spatial")) | |
| slope <- terrain(tst * 25, opt='slope') | |
| aspect <- terrain(tst * 25, opt='aspect') | |
| hill <- hillShade(slope, aspect, 40, 270) | |
| tst = mask(tst, hill) | |
| options(viewer = NULL) | |
| brks = as.numeric(quantile(tst[], seq(0, 1, length.out=256), na.rm = TRUE)) | |
| # cols = colorRampPalette(c('#00000088','#00ffff88'), alpha = TRUE)(255) | |
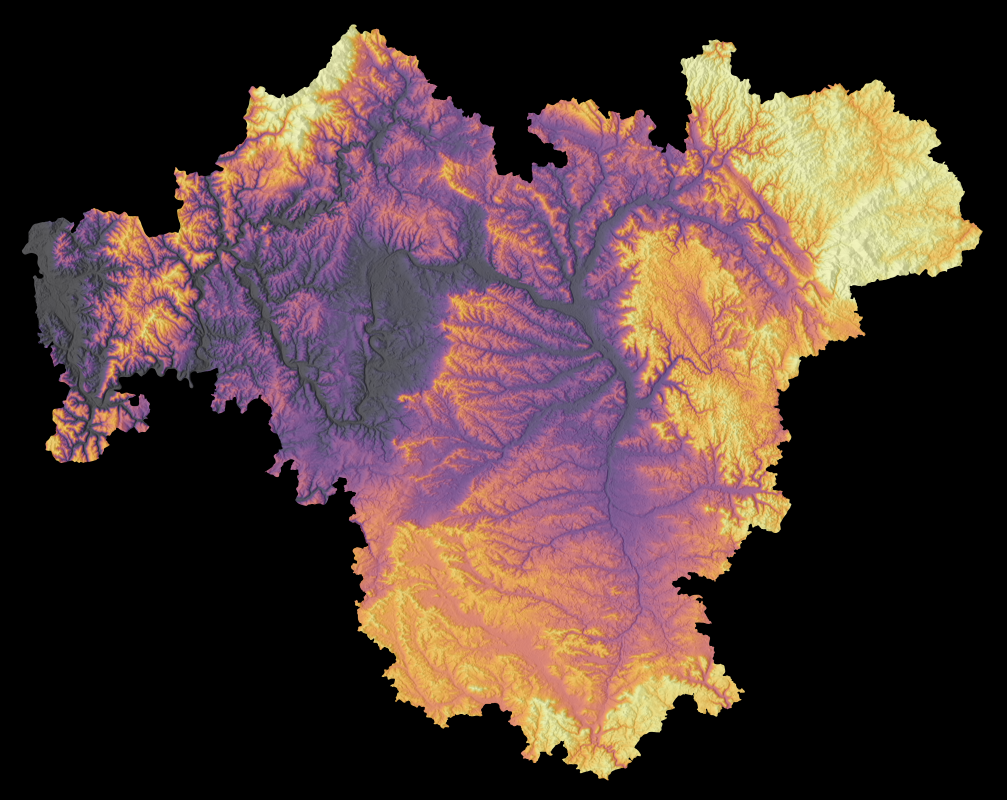
| # cols = viridisLite::inferno(255, alpha = 0.6) | |
| # cols = rev(colorRampPalette(c("#6DCBEC88", "#F649A288", | |
| # "#F6422A88", "#2e052788"), | |
| # alpha = TRUE)(255)) | |
| # cols = rev(colorRampPalette(c("#ffffff88", "#3e4bc188", "#26262688"), | |
| # alpha = TRUE)(255)) | |
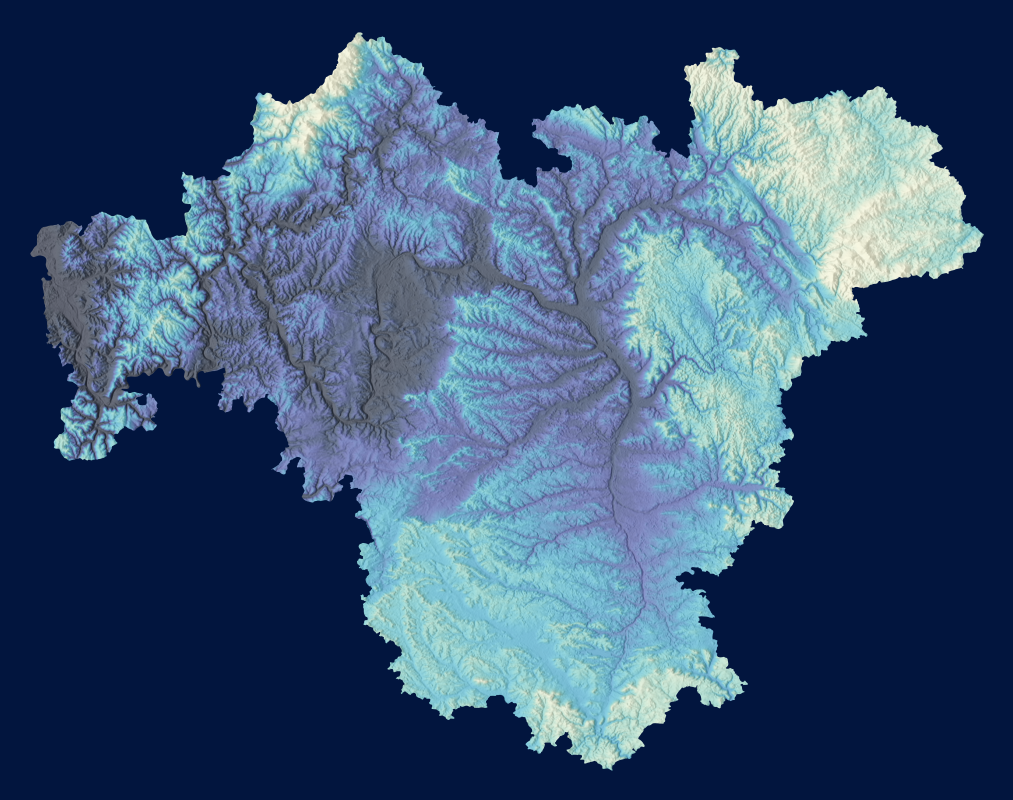
| cols = rev( | |
| colorRampPalette( | |
| c( | |
| paste0( | |
| brewer.pal(9, "YlGnBu")[c(1, 4:9)], | |
| "88" | |
| ), | |
| "#030b2288" | |
| ), | |
| interpolate = "spline", | |
| alpha = TRUE | |
| )(255) | |
| ) | |
| xy_ratio = ncol(tst) / nrow(tst) | |
| png(filename = "/home/timpanse/software/franconia_ele/fran_ele_suicide.png", | |
| width = 80 * xy_ratio, height = 80, units = "cm", res = 300, bg = "#02194A") | |
| par(bty = "n") | |
| image(hill, col = grey.colors(10000), axes = FALSE, xlab = "", ylab = "", | |
| maxpixels = ncell(hill)) | |
| image(tst, col = cols, breaks = brks, axes = FALSE, xlab = "", ylab = "", | |
| add = TRUE, maxpixels = ncell(tst)) | |
| # plot(mask, col = "black", reset = FALSE, lwd = 2, add = TRUE) | |
| dev.off() | |
| img = image_read("/home/timpanse/software/franconia_ele/fran_ele_suicide.png") | |
| img = image_contrast(img, sharpen = 4) | |
| image_write(img, "/home/timpanse/software/franconia_ele/fran_ele_suicide2.png") | |
| img = image_scale(img, "1024x800") | |
| image_write(img, "/home/timpanse/software/franconia_ele/fran_ele_suicide2_preview.png") | |
| # png(filename = "/home/timpanse/software/franconia_ele/fran_ele.png", | |
| # width = 120, height = 120, units = "cm", res = 300, bg = "transparent") | |
| # par(bty = "n") | |
| # plot(hill, col = grey.colors(10000), axes = FALSE, | |
| # legend = FALSE, maxpixels = ncell(hill)) | |
| # plot(tst, col = cols, alpha = 0.6, | |
| # add = TRUE, legend = FALSE, maxpixels = ncell(tst)) | |
| # dev.off() | |
| # trim | |
| # img = image_read("/home/timpanse/software/franconia_ele/fran_ele_inferno.png") | |
| # | |
| # | |
| # | |
| # | |
| # | |
| # img = image_trim(img) | |
| # image_write(img, path = "/home/timpanse/software/franconia_ele/fran_ele_trm.png") | |
| # | |
| # | |
| # colorRampPalette(c("cyan", "black"))(10000) | |
| # | |
| # | |
| # mapview(hill, col.regions = grey.colors, alpha.regions = 1, | |
| # na.color = "transparent", maxpixels = ncell(hill)) + | |
| # mapview(tst, alpha.regions = 0.6, na.color = "transparent", | |
| # maxpixels = ncell(tst)) | |
| # | |
| # plainview(hill, col.regions = grey.colors, alpha.regions = 1, | |
| # na.color = "transparent", maxpixels = ncell(hill)) | |
| # |
Author
tim-salabim
commented
Dec 19, 2019
I think I'd want to also get a smaller version printed in the following colors (which would be the inferno colour option (commented out):
Sign up for free
to join this conversation on GitHub.
Already have an account?
Sign in to comment