Last active
July 24, 2017 16:31
-
-
Save tjlane/1d0c7d7d1f93ec8fcadd53593fbe25b2 to your computer and use it in GitHub Desktop.
Draft Timetool Processing Improvements for psana
This file contains bidirectional Unicode text that may be interpreted or compiled differently than what appears below. To review, open the file in an editor that reveals hidden Unicode characters.
Learn more about bidirectional Unicode characters
| #!/usr/bin/env python | |
| import psana | |
| import numpy as np | |
| from skimage import measure | |
| from scipy import signal | |
| from ttanalyzer import TTAnalyzer | |
| def relative_time(edge_position): | |
| """ | |
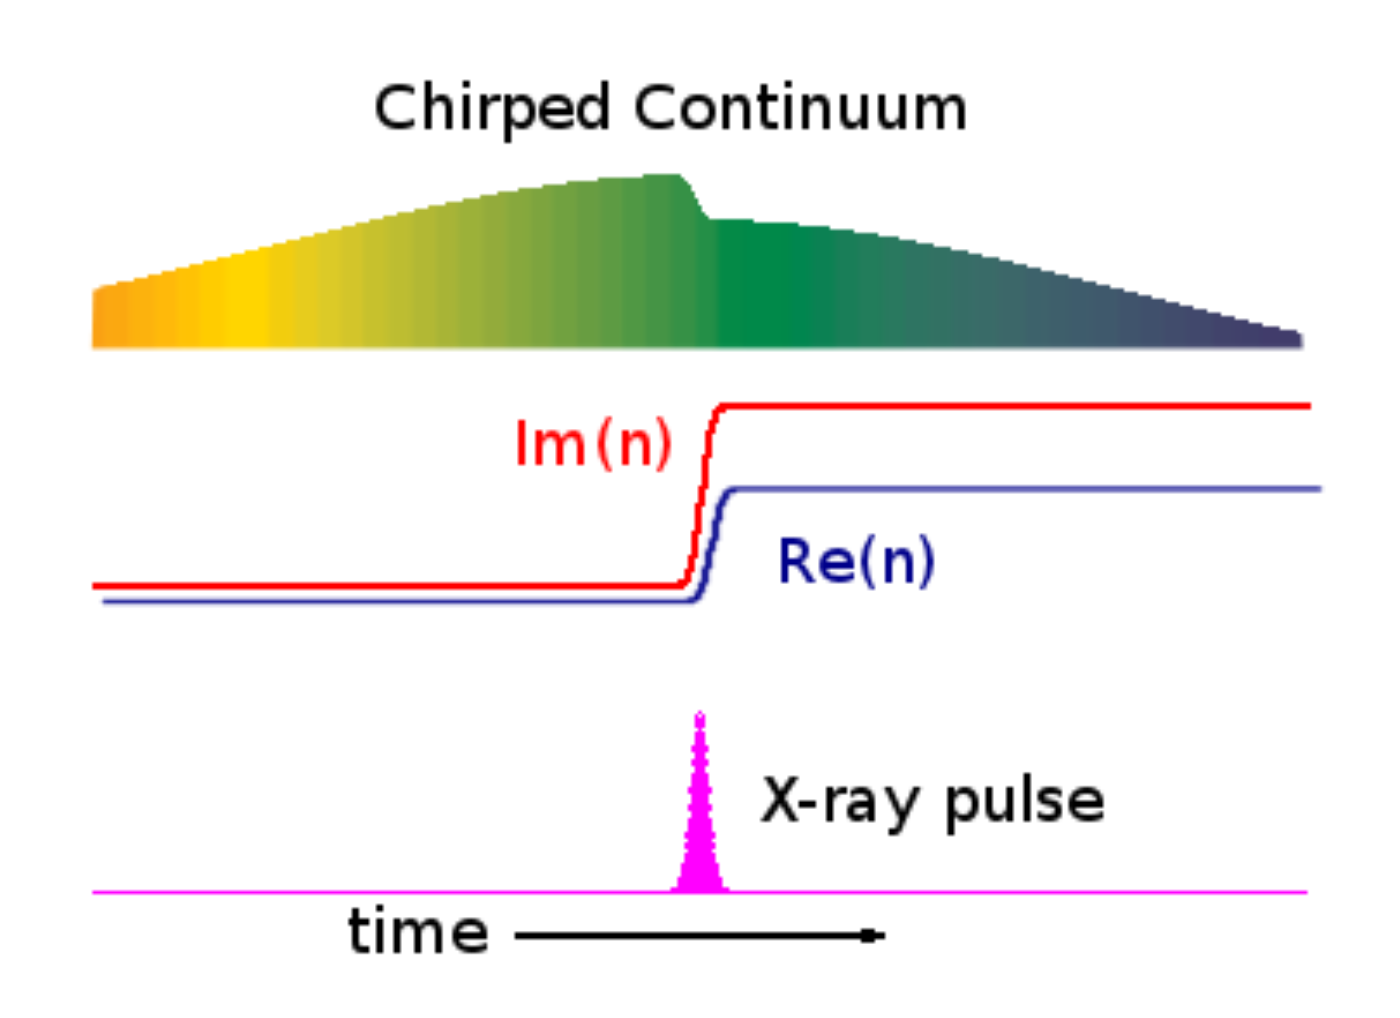
| Translate edge position into fs (for cxij8816) | |
| from docs >> fs_result = a + b*x + c*x^2, x is edge position | |
| """ | |
| a = -0.0013584927458976459 | |
| b = 3.1264188429430901e-06 | |
| c = -1.1172611228659911e-09 | |
| x = tt_pos(evt) | |
| tt_correction = a + b*x + c*x**2 | |
| time_delay = las_stg(evt) | |
| return -1000*(time_delay + tt_correction) | |
| RUN = '219,220,221' | |
| ds = psana.MPIDataSource('exp=cxij8816:run=%s' % str(RUN)) | |
| #ds.break_after(5000) | |
| smldata = ds.small_data('run-%s-small.h5' % str(RUN)) | |
| evr = psana.Detector('NoDetector.0:Evr.0') | |
| tt_camera = psana.Detector('Timetool') | |
| tt_pos = psana.Detector('CXI:TTSPEC:FLTPOS') | |
| tt_amp = psana.Detector('CXI:TTSPEC:AMPL') | |
| tt_fwhm = psana.Detector('CXI:TTSPEC:FLTPOSFWHM') | |
| ttana = TTAnalyzer() | |
| for i,evt in enumerate(ds.events()): | |
| print RUN, '::', i | |
| # extract the TT trace | |
| tt_img = tt_camera.raw(evt) | |
| left = signal.medfilt(tt_img[:,:30].sum(1)) | |
| right = signal.medfilt(tt_img[:,-31:].sum(1)) | |
| start = (0, np.argmax(left)) | |
| end = (tt_img.shape[1], np.argmax(right)) | |
| tt_spectrum = measure.profile_line(tt_img.T, start, end, linewidth=4) | |
| event_codes = evr(evt) | |
| tt_ana_res = ttana(tt_spectrum) | |
| smldata.event(tt_spectrum = tt_spectrum, | |
| daq_pos = tt_pos(evt), | |
| daq_amp = tt_amp(evt), | |
| daq_fwhm = tt_fwhm(evt), | |
| tt_pos = tt_ana_res[0], | |
| tt_amp = tt_ana_res[1], | |
| tt_fwhm = tt_ana_res[2], | |
| xray_on = int(162 not in event_codes), | |
| uv_on = int(183 in event_codes)) | |
| smldata.save() | |
This file contains bidirectional Unicode text that may be interpreted or compiled differently than what appears below. To review, open the file in an editor that reveals hidden Unicode characters.
Learn more about bidirectional Unicode characters
| import psana | |
| from matplotlib import pyplot as plt | |
| from skimage import transform, measure | |
| from scipy import signal | |
| import numpy as np | |
| ds = psana.DataSource('exp=cxij8816:run=221') | |
| tt_camera = psana.Detector('Timetool') | |
| for i,evt in enumerate(ds.events()): | |
| print i | |
| # get the raw TT camera image | |
| tt_img = tt_camera.raw(evt) | |
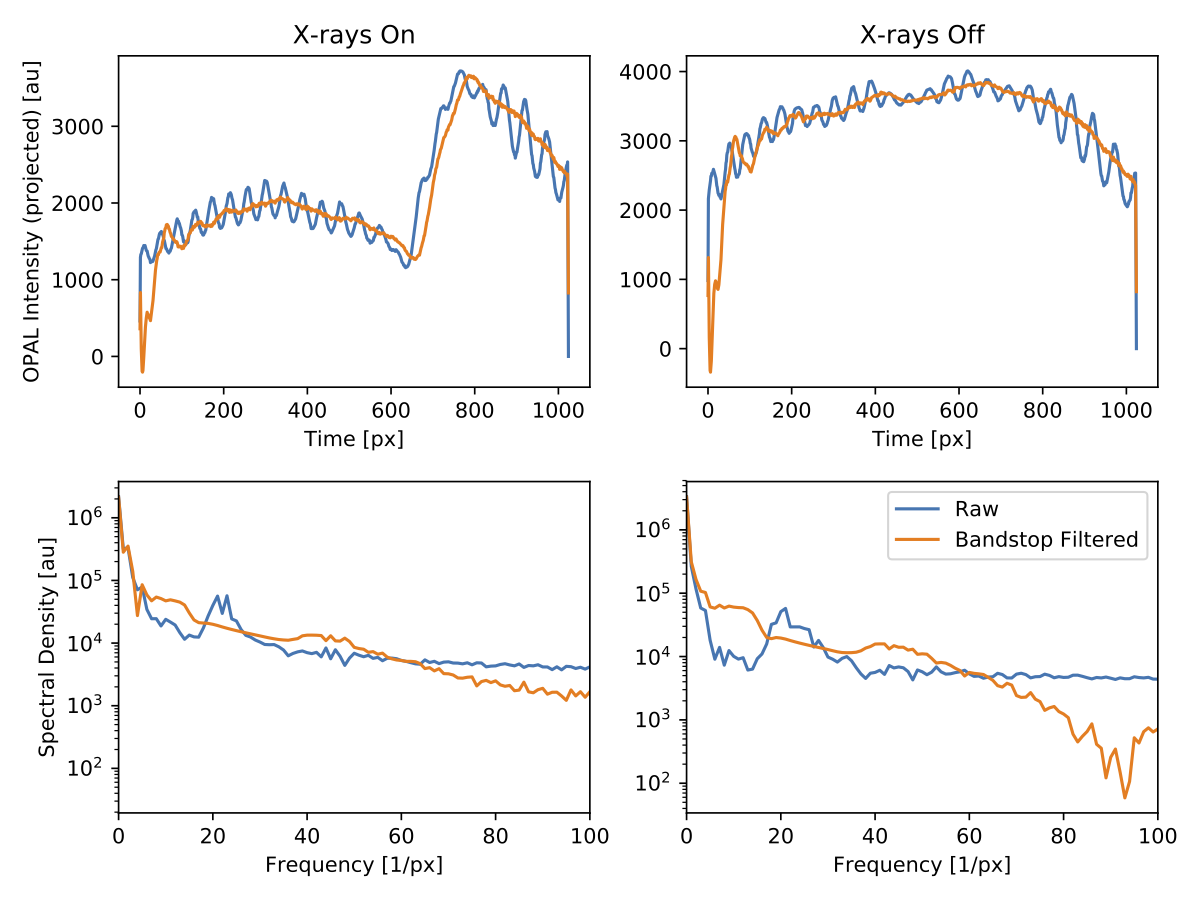
| proj = tt_img.sum(0) | |
| # extract the TT signal using an ROI | |
| # simple idea, find maxima on either side of TT | |
| left = signal.medfilt(tt_img[:,:30].sum(1)) | |
| right = signal.medfilt(tt_img[:,-31:].sum(1)) | |
| start = (0, np.argmax(left)) | |
| end = (tt_img.shape[1], np.argmax(right)) | |
| print start, end | |
| x = np.array([start, end]) | |
| profile = measure.profile_line(tt_img.T, start, end, linewidth=4) | |
| plt.figure(figsize=(6,10)) | |
| plt.subplot(311) | |
| plt.plot(proj) | |
| plt.plot(profile) | |
| plt.subplot(312) | |
| plt.imshow(tt_img, aspect='auto') | |
| plt.plot(x[:,0], x[:,1], '-', color='orange', lw=2) | |
| plt.subplot(313) | |
| plt.plot(left) | |
| plt.plot(right) | |
| plt.show() |
This file contains bidirectional Unicode text that may be interpreted or compiled differently than what appears below. To review, open the file in an editor that reveals hidden Unicode characters.
Learn more about bidirectional Unicode characters
| import numpy as np | |
| from scipy import signal | |
| import psana | |
| from pylab import find | |
| class TTAnalyzer(object): | |
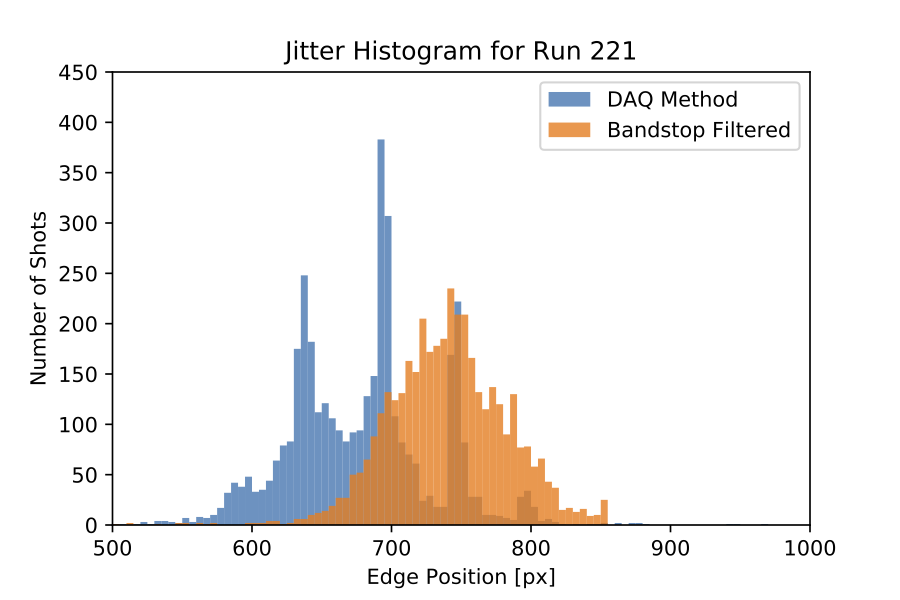
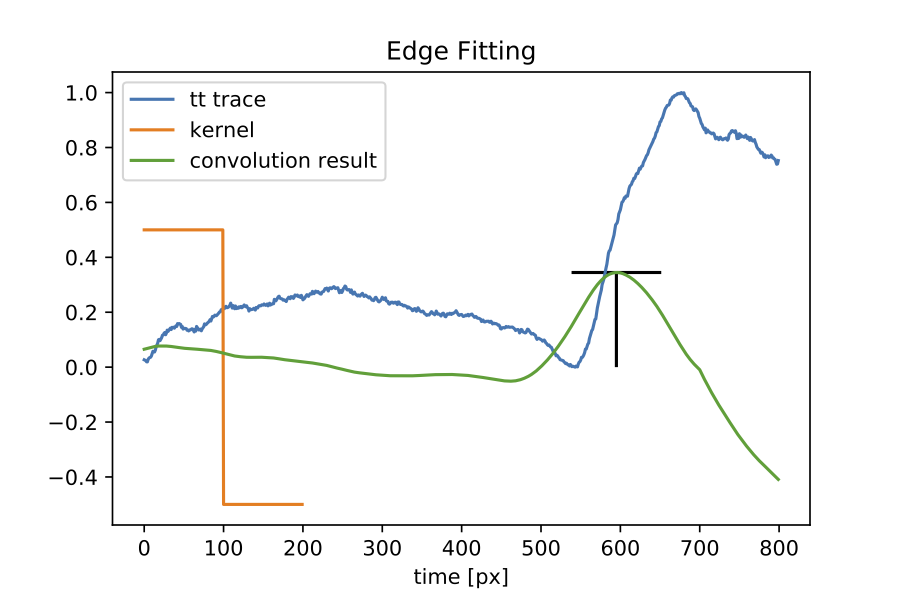
| def __init__(self, kernel=None, tt_window=[50,950], | |
| bandcut=[15.0, 40.0], butterworth_order=5): | |
| if kernel == None: | |
| # default | |
| k = np.zeros(200) | |
| k[:100] = 1 | |
| k -= 0.5 | |
| self.kernel = k | |
| else: | |
| self.kernel = kernel | |
| self.tt_window = tt_window | |
| self.bandcut = bandcut | |
| self.butterworth_order = butterworth_order | |
| return | |
| def __call__(self, trace): | |
| if len(trace.shape) == 1: | |
| t = self.butter_bandstop_filter(trace) | |
| t = t[self.tt_window[0]:self.tt_window[1]] | |
| edge, amp, fwhm = self.find_edge(t, return_conv_trace=False) | |
| res = edge + self.tt_window[0], amp, fwhm | |
| elif len(trace.shape) == 2: | |
| res = np.zeros((trace.shape[0], 3)) | |
| for i in range(trace.shape[0]): | |
| t = self.butter_bandstop_filter(trace[i]) | |
| t = t[self.tt_window[0]:self.tt_window[1]] | |
| edge, amp, fwhm = self.find_edge(t, return_conv_trace=False) | |
| res[i] = np.array([edge + self.tt_window[0], amp, fwhm]) | |
| else: | |
| raise ValueError('`trace` must be 1d or 2d') | |
| return res | |
| @staticmethod | |
| def normalize(x): | |
| n = x - x.min() | |
| n = n / n.max() | |
| return n | |
| @staticmethod | |
| def find_fwhm(x): | |
| half_max = np.max(x) / 2. | |
| d = np.sign(half_max - np.array(x[0:-1])) - np.sign(half_max - np.array(x[1:])) | |
| try: | |
| left_idx = find(d > 0)[0] | |
| right_idx = find(d < 0)[-1] | |
| fwhm = right_idx - left_idx | |
| except: | |
| fwhm = -1.0 | |
| return fwhm | |
| def find_edge(self, trace, return_conv_trace=False): | |
| n_trace = self.normalize(trace) | |
| cv = signal.fftconvolve(n_trace, self.kernel, mode='same') | |
| edge = np.argmax(cv) | |
| amp = cv[edge] | |
| fwhm = self.find_fwhm(cv) | |
| if return_conv_trace: | |
| return edge, amp, fwhm, cv | |
| else: | |
| return edge, amp, fwhm | |
| @staticmethod | |
| def _butter_bandstop(lowcut, highcut, fs, order=5): | |
| nyq = 0.5 * fs | |
| low = lowcut / nyq | |
| high = highcut / nyq | |
| b, a = signal.butter(order, [low, high], btype='bandstop') | |
| return b, a | |
| def butter_bandstop_filter(self, data): | |
| if len(data.shape) not in [1,2]: | |
| raise ValueError('`data` must be 1d or 2d') | |
| b, a = self._butter_bandstop(self.bandcut[0], | |
| self.bandcut[1], | |
| data.shape[-1], | |
| order=self.butterworth_order) | |
| y = signal.lfilter(b, a, data) | |
| return y | |
Author
tjlane
commented
Jul 24, 2017
•


Sign up for free
to join this conversation on GitHub.
Already have an account?
Sign in to comment