The fgsea::fgsea function returns a data.frame with the following columns:
-
pathway– name of the pathway as in ‘names(pathway)‘; -
pval– an enrichment p-value; -
padj– a BH-adjusted p-value; -
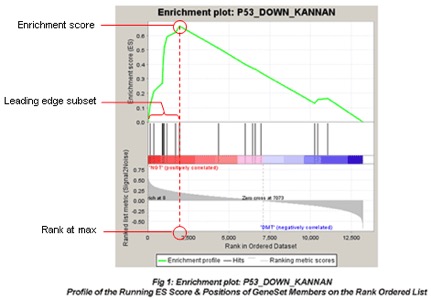
ES– enrichment scoreGSEA calculates the ES by walking down the ranked list of genes, increasing a running-sum statistic when a gene is in the gene set and decreasing it when it is not. The magnitude of the increment depends on the correlation of the gene with the phenotype. The ES is the maximum deviation from zero encountered in walking the list. A positive ES indicates gene set enrichment at the top of the ranked list; a negative ES indicates gene set enrichment at the bottom of the ranked list.
- See GSEA website for more details.
-
NES– enrichment score normalized to mean enrichment of random samples of the same size;The normalized enrichment score (NES) is the primary statistic for examining gene set enrichment results. [... it] accounts for differences in gene set size and in correlations between gene sets and the expression dataset;
- See GSEA website for more details.
-
nMoreExtreme– a number of times a random gene set had a more extreme enrichment score value; -
size– size of the pathway after removing genes not present in ‘names(stats)‘. -
leadingEdge– vector with indexes of leading edge genes that drive the enrichmentThe leading-edge subset in a gene set are those genes that appear in the ranked list at or before the point at which the running sum reaches its maximum deviation from zero.