-
download the source data
wget http://fred.dev.openstreetmap.org/density/tiles.13 wget http://fred.dev.openstreetmap.org/density/tiles.16 -
convert to simple, gnuplot-readable text format
sed 's/\([0-9]*\) z=\([0-9]*\) x=\([0-9]*\) y=\([0-9]*\)/\3 \4 \1/' < tiles.13 > tiles.13.txt sed 's/\([0-9]*\) z=\([0-9]*\) x=\([0-9]*\) y=\([0-9]*\)/\3 \4 \1/' < tiles.16 > tiles.16.txt -
start gnuplot
gnuplot -
use gnuplot to create the map
reset unset xtics unset ytics unset border unset key unset legend unset title set lmargin at screen 0 set tmargin at screen 0 set rmargin at screen 1 set bmargin at screen 1 set palette rgbformulae 34,35,36 width = 1024 set xrange [0:width-1] set yrange [0:width] set object rectangle from screen 0,0 to screen 1,1 fillcolor rgb"#000000" behind set terminal png size width,width set output "density.13.png" plot 'tiles.13.txt' using ($1/8):(width-1-$2/8):(log($3)) with dots palette -
repeat with zoom-16 tiles (don't forget to adapt the numbers above)
Last active
May 9, 2022 18:08
-
-
Save tyrasd/5879119 to your computer and use it in GitHub Desktop.
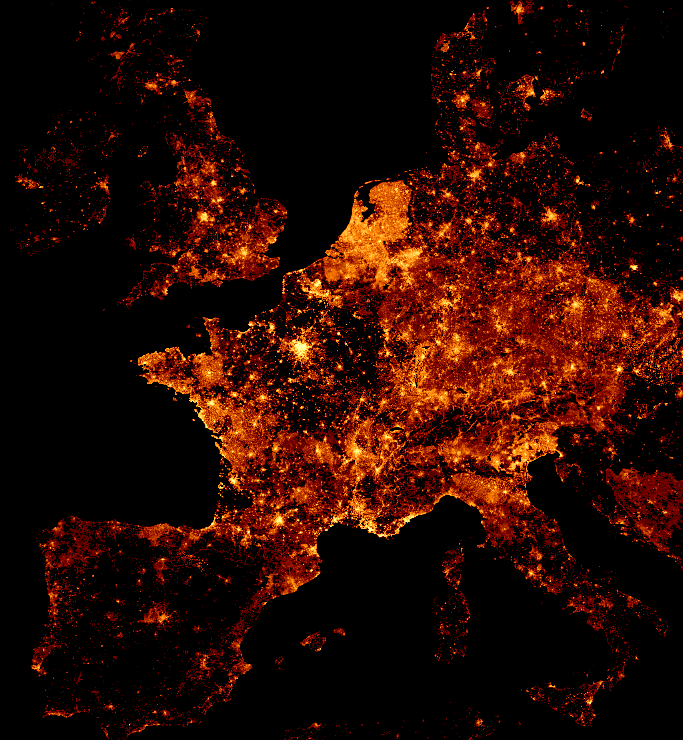
This is how I've visualized OpenStreetMap's node density.
Sign up for free
to join this conversation on GitHub.
Already have an account?
Sign in to comment
Please Fred, is there a way to specify for Africa alone.