Created
March 31, 2021 14:47
-
-
Save uribo/8feb605e6f38c8131edd4abd69edf220 to your computer and use it in GitHub Desktop.
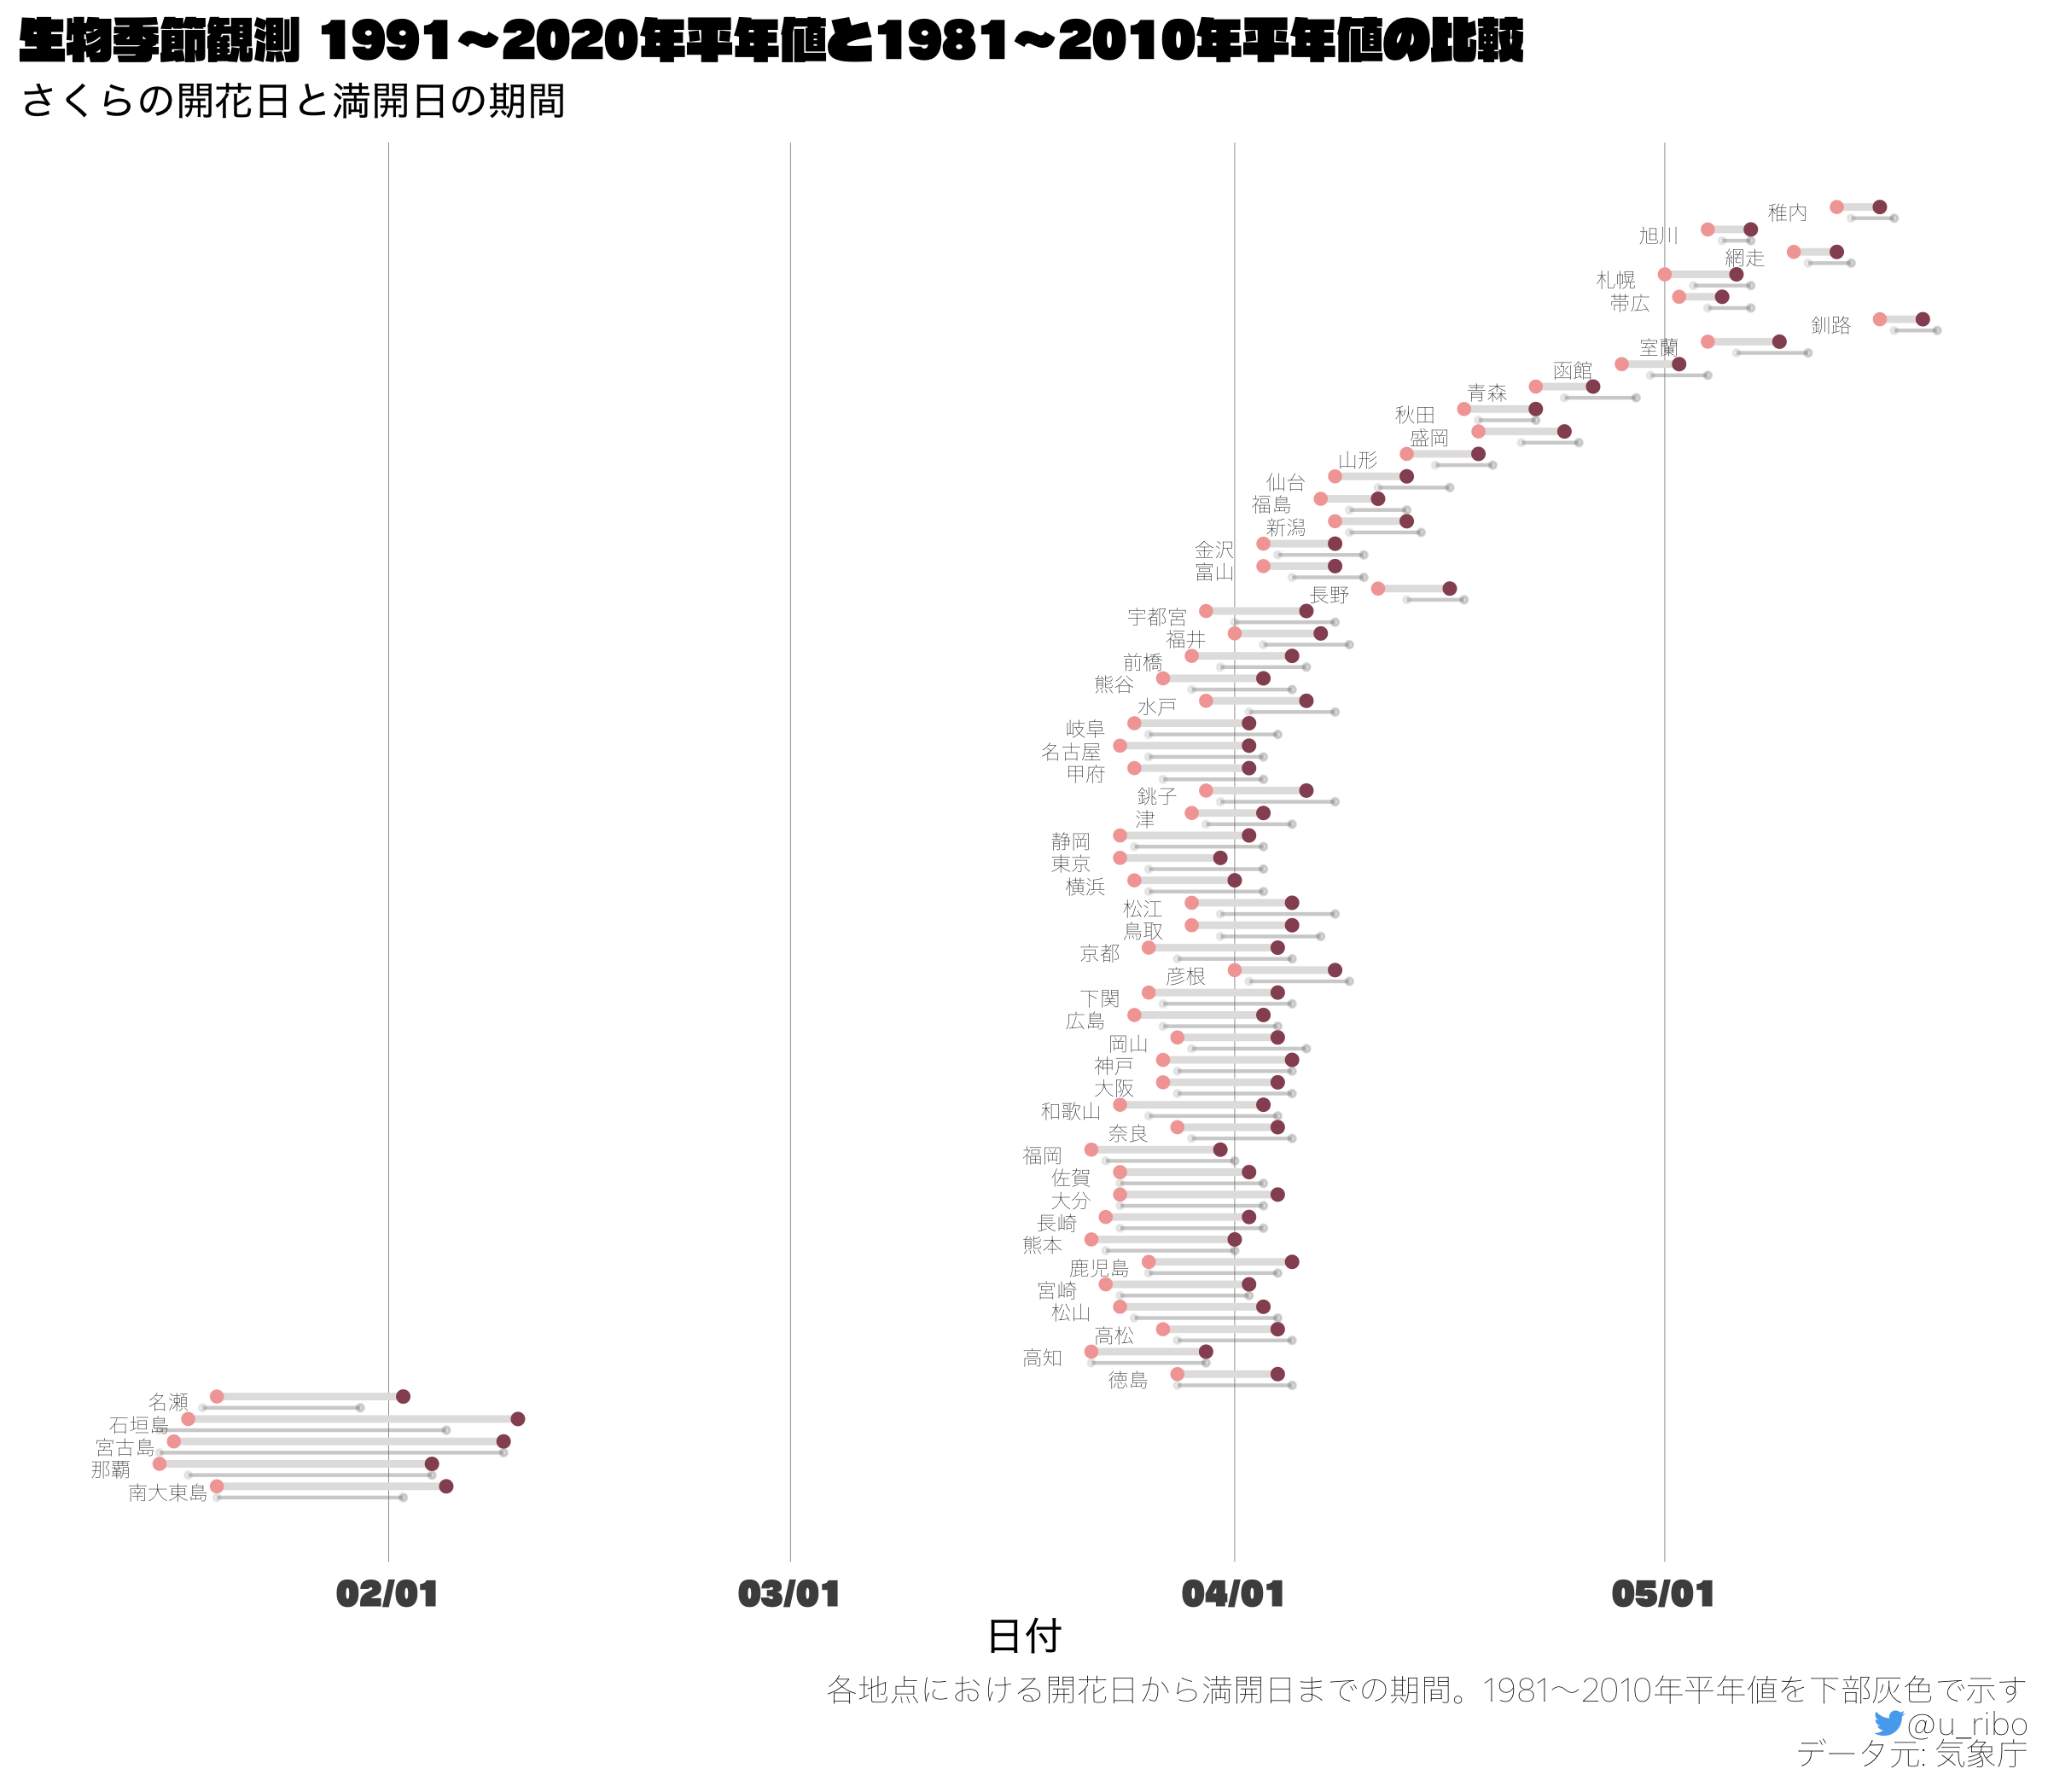
生物季節観測 さくらの開花日・満開日の期間
This file contains bidirectional Unicode text that may be interpreted or compiled differently than what appears below. To review, open the file in an editor that reveals hidden Unicode characters.
Learn more about bidirectional Unicode characters
| #################################### | |
| # 月*100+日 | |
| # 9月5日 --> 905 | |
| #################################### | |
| library(readr) | |
| library(dplyr) | |
| library(ggplot2) | |
| library(ggalt) | |
| d <- | |
| read_csv("~/Downloads/normal_phenology/nml_phenology.csv", | |
| locale = locale(encoding = "cp932")) | |
| convert_phenology_longer <- function(data, type) { | |
| data %>% | |
| filter(`種目名` == {{ type }}) %>% | |
| select(!c(`種目名`, starts_with("地点番号"))) %>% | |
| tidyr::pivot_longer(cols = everything(), | |
| names_to = "area", | |
| values_to = "value") %>% | |
| mutate(month = round((value / 100)), | |
| day = round((value %% 100)), | |
| dummy_date = lubridate::make_date(2020, month, day), | |
| area = dplyr::recode(area, | |
| `津` = " 津")) %>% | |
| mutate(area = forcats::fct_rev(forcats::fct_inorder(area))) | |
| } | |
| d <- | |
| d %>% | |
| purrr::set_names( | |
| c("種目名", | |
| purrr::map2( | |
| stringr::str_trim(names(d)[seq.int(2, ncol(d), by = 2)]), | |
| paste0("地点番号_", | |
| names(d)[seq.int(3, ncol(d), by = 2)]), | |
| c | |
| ) %>% | |
| purrr::flatten_chr() | |
| )) %>% | |
| mutate(`種目名` = stringr::str_trim(`種目名`)) | |
| df_mankai2020 <- | |
| convert_phenology_longer(d, "さくらの満開日") | |
| df_kaika2020 <- | |
| convert_phenology_longer(d, "さくらの開花日") | |
| interval_data <- function(data1, data2) { | |
| data1 %>% | |
| select(area, start_date = dummy_date) %>% | |
| left_join(data2 %>% | |
| select(area, end_date = dummy_date), | |
| by = "area") | |
| } | |
| dumbbell_plot <- function(data1, data2) { | |
| interval_data(data1, data2) %>% | |
| ggplot(aes(y = area, | |
| x = start_date, | |
| xend = end_date)) + | |
| geom_dumbbell( | |
| size = 1, | |
| color = "#e3e2e1", | |
| colour_x = "#f3a7a5", | |
| colour_xend = "#965161", | |
| dot_guide = FALSE) + | |
| theme_minimal() + | |
| scale_x_date(date_labels = "%m/%d") + | |
| theme(panel.grid.major.y = element_line(size = 0.05)) | |
| } | |
| dumbbell_plot(df_kaika2020, df_mankai2020) + | |
| labs(title = "生物季節観測 2020年平年値", | |
| subtitle = "さくらの開花日と満開日", | |
| x = "日付", | |
| y = "地点") | |
| # 1981~2010の平均値 ----------------------------------------------------------- | |
| library(tabulizer) | |
| library(dplyr) | |
| tbl_vars <- | |
| c("番号", "地点名", | |
| purrr::map2( | |
| paste0("yr", seq.int(2016, 2020)), | |
| paste0("yr", seq.int(2016, 2020), "rm"), | |
| c) %>% | |
| purrr::flatten_chr(), | |
| "平均値", "平均値rm", | |
| "最早値", "最早値rm", | |
| "最早年", | |
| "最晩値", "最晩値rm", | |
| "最晩年") | |
| tbl_data_kaika <- | |
| tabulizer::extract_tables("~/Library/Mobile Documents/com~apple~CloudDocs/sakura004.pdf", | |
| pages = 7:8, | |
| output = "matrix") | |
| tbl_data_mankai <- | |
| tabulizer::extract_tables("~/Library/Mobile Documents/com~apple~CloudDocs/sakura_mainkai005.pdf", | |
| pages = 7:8, | |
| output = "matrix") | |
| convert_tbl_data_df <- function(data) { | |
| seq.int(2, nrow(data)) %>% | |
| purrr::map_dfr( | |
| ~ as.data.frame(t(paste(data[.x, ], collapse = " ") %>% | |
| stringr::str_split("[[:space:]]", | |
| simplify = TRUE) %>% | |
| c()))) %>% | |
| purrr::set_names(tbl_vars) %>% | |
| as_tibble() %>% | |
| mutate(across(where(is.character), | |
| ~ na_if(., "-"))) %>% | |
| mutate(across(where(is.character), | |
| ~ na_if(., "--"))) %>% | |
| mutate(across(everything(), | |
| stringr::str_remove_all, | |
| pattern = "-")) %>% | |
| readr::type_convert() | |
| } | |
| df_mankai2010 <- | |
| bind_rows( | |
| convert_tbl_data_df(tbl_data_mankai[[1]]), | |
| convert_tbl_data_df(tbl_data_mankai[[2]])) %>% | |
| select(2, 13) %>% | |
| purrr::set_names(c("area", "value")) %>% | |
| mutate(area = dplyr::recode(area, `津` = " 津")) %>% | |
| filter(area %in% df_kaika2020$area) %>% | |
| mutate(area = forcats::fct_rev(forcats::fct_inorder(area))) | |
| df_mankai2010 %>% | |
| filter(area == '東京') | |
| df_mankai2020 %>% | |
| filter(area == '東京') | |
| df_kaika2020 %>% | |
| filter(area == '東京') | |
| df_mankai2010 <- | |
| df_mankai2010 %>% | |
| mutate(value = dplyr::if_else(area == "舞鶴", | |
| 408, | |
| value), | |
| value = dplyr::if_else(area == "石垣島", | |
| 205, | |
| value), | |
| value = dplyr::if_else(area == "宮古島", | |
| 209, | |
| value), | |
| value = dplyr::if_else(area == "南大東島", | |
| 202, | |
| value), | |
| value = dplyr::if_else(area %in% c("与那国島", "西表島"), | |
| NA_real_, | |
| value)) %>% | |
| mutate(month = round((value / 100)), | |
| day = round((value %% 100)), | |
| dummy_date = lubridate::make_date(2010, month, day)) | |
| df_kaika2010 <- | |
| bind_rows( | |
| convert_tbl_data_df(tbl_data_kaika[[1]]), | |
| convert_tbl_data_df(tbl_data_kaika[[2]])) %>% | |
| select(2, 13) %>% | |
| purrr::set_names(c("area", "value")) %>% | |
| mutate(area = dplyr::recode(area, `津` = " 津")) %>% | |
| mutate(month = round((value / 100)), | |
| day = round((value %% 100)), | |
| dummy_date = lubridate::make_date(2010, month, day)) %>% | |
| filter(area %in% df_kaika2020$area) %>% | |
| mutate(area = forcats::fct_rev(forcats::fct_inorder(area))) | |
| dumbbell_plot(df_kaika2010, df_mankai2010) + | |
| labs(title = "生物季節観測 2010年平年値", | |
| subtitle = "さくらの開花日と満開日", | |
| x = "日付", | |
| y = "地点") | |
| library(lubridate) | |
| df_compare <- | |
| bind_rows( | |
| interval_data(df_kaika2010, df_mankai2010) %>% | |
| mutate(type = "old"), | |
| interval_data(df_kaika2020, df_mankai2020) %>% | |
| mutate(type = "new", | |
| start_date = make_date(2010, | |
| month(start_date), | |
| day(start_date)), | |
| end_date = make_date(2010, | |
| month(end_date), | |
| day(end_date)))) %>% | |
| arrange(desc(area), type) %>% | |
| mutate(area = forcats::fct_rev(forcats::fct_inorder(paste0(area, type)))) %>% | |
| mutate(dummy_area = as.numeric(area)) | |
| p <- | |
| df_compare %>% { | |
| ggplot(.) + | |
| geom_dumbbell( | |
| data = dplyr::filter(., type == "new"), | |
| aes(y = dummy_area, | |
| x = start_date, | |
| xend = end_date), | |
| size = 1, | |
| color = "#e3e2e1", | |
| colour_x = "#f3a7a5", | |
| colour_xend = "#965161", | |
| dot_guide = FALSE) + | |
| geom_text(data = dplyr::filter(., type == "new") %>% | |
| mutate(area = stringr::str_remove(area, "new")), | |
| aes(y = dummy_area, | |
| x = start_date, | |
| family = "HiraginoSans-W0", | |
| label = area), | |
| size = 2, | |
| color = "black", | |
| nudge_x = -3.4, | |
| nudge_y = -0.5) + | |
| geom_dumbbell( | |
| data = dplyr::filter(., type == "old"), | |
| aes(y = dummy_area, | |
| x = start_date, | |
| xend = end_date), | |
| size = 0.5, | |
| color = "#80808060", | |
| colour_x = "#80808020", | |
| colour_xend = "#80808040", | |
| dot_guide = FALSE) + | |
| theme_minimal(base_family = "FOT-RaglanPunch Std UB") + | |
| scale_y_continuous(breaks = NULL) + | |
| # scale_y_continuous(breaks = seq.int(1.5, 116.5, by = 2), | |
| # labels = levels(df_kaika2020$area)) + | |
| scale_x_date(date_labels = "%m/%d") + | |
| theme( | |
| axis.title = element_text(family = "HiraginoSans-W4"), | |
| plot.subtitle = element_text(family = "HiraginoSans-W4"), | |
| plot.caption = element_markdown(family = "HiraginoSans-W0"), | |
| panel.grid.major.x = element_line(size = 0.05), | |
| panel.grid = element_blank()) | |
| } | |
| p + | |
| labs(title = "生物季節観測 1991~2020年平年値と1981~2010年平年値の比較", | |
| subtitle = "さくらの開花日と満開日の期間", | |
| caption = "各地点における開花日から満開日までの期間。1981~2010年平年値を下部灰色で示す<br><span style='font-family: \"Font Awesome 5 Brands\"; color:#55acee'></span>@u_ribo<br>データ元: 気象庁", x = "日付", | |
| y = NULL) | |
| ggsave(filename = "out.png", width = 8, height = 7) |
Author
uribo
commented
Mar 31, 2021
Sign up for free
to join this conversation on GitHub.
Already have an account?
Sign in to comment