This project was completed as part of the Programming for Everybody specialization through Coursera, taken with Dr. Chuck Severance. The project demonstrates mastery of the concepts learned in intermediate Python programming.
My project uses Python to collect temperature for a specific location (my home) across five data sources: four APIs and one temperature sensor located at my house. The temperature sensor is a DS18B20 digital sensor connected to a Raspberry Pi through a custom shield that I soldered together. There is not much special about the shield; if you can connect the sensor to GPIO BCM pin 25 on the Pi, you will be good to go. I put the collected data into a SQLite database, then extract data from the database to build a simple line graph with Plotly.
Here is a simple rundown of how to run the code and what you will need:
-
Read comments in webTemp.py for tips on how to get your Pi to recognize the sensor and take readings from it. You are welcome to use another board, as long as you can get it to read the temperature sensor.
-
weatherAPIs.py imports webTemp.py and uses it to read the sensor. You can split up this code if that works better for you, but this is how I structured it.
-
Register with the APIs in weatherAPIs.py. I keep my unique API keys in environment variables on my system in /etc/environment, which exists in Raspbian. Depending on the OS of your board, you might not have this file. You can put the API keys directly into your code if you so choose, but I treat these as credentials and don't hard-code them. You also need to determine your latitude and longitude coordinates, which you can find on a mapping site. I keep these in /etc/environment too, but they could be hard-coded in your code along with your API keys.
-
Run collectTemp.py to grab data from all of your inputs and write it to a SQLite database. Given the API daily limits, I set my interval to three minutes between readings. If the APIs change their limits, you may need to adjust this value. You can use nohup to background the process, allowing you to log out and keep the code running.
-
Once you have collected some data, you can run tempsPlotly.py to create a visualization. The code uses the Plotly Python line graph API and outputs an HTML file and opens it in your default browser. You can export the graphic to a static PNG image, and you can also upload your results to Plotly and host with them. Here is a usage example for tempsPlotly.py:
tempsPlotly.py [-h] -t {daily,weekly,monthly,currmonth}
The goal of this project is not only to work with Python and databases, but also to create useful visualizations. For example, my runs using this code created the following visualization:
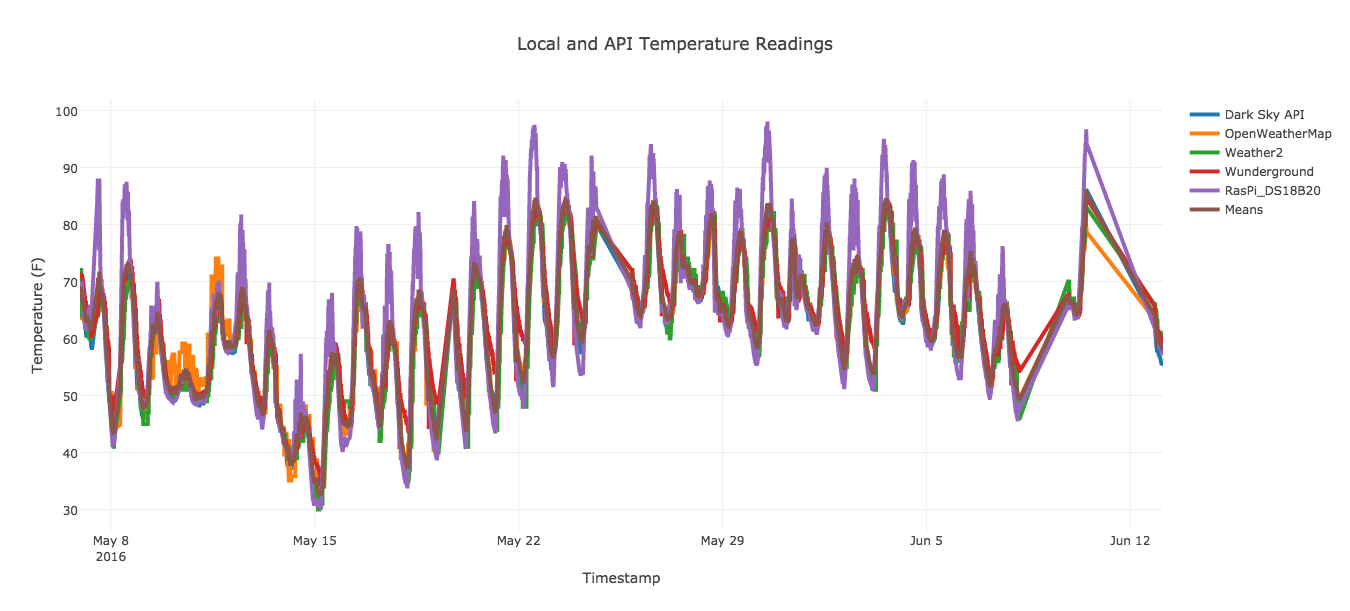
Fetching data is not perfect. For example, I found that the Weather2 API goes down randomly, which originally caused my program to crash. The error handling I created to counter this involves writing a "999.99" value to the SQLite database. When going to create the visualization, you need to make sure your query excludes those very large values. My approach to this problem is to select only rows where the temps_mean value is less than 150.00. That should allow us some room for climate change, but be sure to update in 25 years or so.
Additionally, my home thermometer runs into problems with direct sunlight, which causes its reading to skyrocket. I am still working to remedy this problem. The only ill effect is that readings on sunny days are skewed, which throws off the mean.
d3Vis.html is not my code and belongs to Michael Bostock. His code is covered by a BSD license, which can be found in D3_LICENSE.txt and at https://github.com/mbostock/d3/blob/master/LICENSE.
I have not found licensing info for Simon Monk's DS18B20 code supplied through the Adafruit website. In that case, I have included links to the tutorial where I found the code as attribution. All rights to that code belong to its authors and/or sponsors. This attribution covers the webTemp.py source file.
Plotly code is covered by an MIT license, with documentation covered by a Creative Commons license. Please see details here: https://github.com/plotly/plotly.js#copyright-and-license
collectTemp.py, weatherAPIs.py, and tempsVis.py are covered by an MIT license. Please see LICENSE.txt for info.
Point here is that all of the code is free for you to download, use, modify, break, improve, or do anything else with as you see fit. If you choose to redistribute it, make an effort to adhere to the licenses set forth here. Thanks!
In compliance with the terms of the various APIs I used, I am citing and linking to them here:
- Dark Sky API: https://darksky.net/poweredby/
- OpenWeatherMap: http://openweathermap.org/
- Weather2: http://www.myweather2.com/developer/apis.aspx?uref=becda844-8299-4bf6-899b-d771a92b9dbf
- Wunderground: https://www.wunderground.com/weather/api/d/docs
Please view the code repo here: https://github.com/vsx-gh/PfE_Capstone.git