-
-
Save wch/5436415 to your computer and use it in GitHub Desktop.
| max_plots <- 5 | |
| ui <- fluidPage( | |
| headerPanel("Dynamic number of plots"), | |
| sidebarPanel( | |
| sliderInput("n", "Number of plots", value=1, min=1, max=5) | |
| ), | |
| mainPanel( | |
| # This is the dynamic UI for the plots | |
| uiOutput("plots") | |
| ) | |
| ) | |
| server <- function(input, output) { | |
| # Insert the right number of plot output objects into the web page | |
| output$plots <- renderUI({ | |
| plot_output_list <- lapply(1:input$n, function(i) { | |
| plotname <- paste("plot", i, sep="") | |
| plotOutput(plotname, height = 280, width = 250) | |
| }) | |
| # Convert the list to a tagList - this is necessary for the list of items | |
| # to display properly. | |
| do.call(tagList, plot_output_list) | |
| }) | |
| # Call renderPlot for each one. Plots are only actually generated when they | |
| # are visible on the web page. | |
| for (i in 1:max_plots) { | |
| # Need local so that each item gets its own number. Without it, the value | |
| # of i in the renderPlot() will be the same across all instances, because | |
| # of when the expression is evaluated. | |
| local({ | |
| my_i <- i | |
| plotname <- paste("plot", my_i, sep="") | |
| output[[plotname]] <- renderPlot({ | |
| plot(1:my_i, 1:my_i, | |
| xlim = c(1, max_plots), | |
| ylim = c(1, max_plots), | |
| main = paste("1:", my_i, ". n is ", input$n, sep = "") | |
| ) | |
| }) | |
| }) | |
| } | |
| } | |
| shinyApp(ui, server) |
@Georgewiggins here's a solution.
max_plot being a global variable is ok in the nice small proof-of-concept by master @wch, but would likely cause havoc in a bigger application. Simply referring to reactive variables in the for-local-loop is not allowed. However it seems the for-local-loop can be wrapped in an observe.
Example below has max_plot as a reactiveVal and an extra slider to set max_plot
library(shiny)

ui <- pageWithSidebar(

  headerPanel("Dynamic number of plots"),

  sidebarPanel(
    sliderInput("n", "Number of plots", value=1, min=1, max=5),
    sliderInput("max", "Max number of plots", value=5, min=1, max=25,step=1)
  ),

  mainPanel(
    # This is the dynamic UI for the plots
    uiOutput("plots")
  )
)


server = function(input, output,session) {


  # Insert the right number of plot output objects into the web page
  output$plots <- renderUI({
    plot_output_list <- lapply(1:input$n, function(i) {
      plotname <- paste("plot", i, sep="")
      plotOutput(plotname, height = 280, width = 250)
    })

    # Convert the list to a tagList - this is necessary for the list of items
    # to display properly.
    do.call(tagList, plot_output_list)
  })

  # Call renderPlot for each one. Plots are only actually generated when they
  # are visible on the web page.

  #making max_plot variable reactiveVal instead of global, input$max would also do, but that would be too easy...
  max_plots = reactiveVal(5)
  observe({
    max_plots(input$max)
    updateSliderInput(session,"n",min=1, max=input$max)
  })

  ##wrapping the, for me strange(but nice) for-local-loop, seems to restore normal shiny reactive behavior
  observeEvent({c(input$max,input$n)},{
    mp= max_plots()

    for (i in 1:mp) {
      # Need local so that each item gets its own number. Without it, the value
      # of i in the renderPlot() will be the same across all instances, because
      # of when the expression is evaluated.
      local({
        my_i <- i
        plotname <- paste("plot", my_i, sep="")

        output[[plotname]] <- renderPlot({
          plot(1:my_i, 1:my_i,
               xlim = c(1, mp),
               ylim = c(1, mp),
               main = paste("1:", my_i, ".  n is ", input$n, sep = "")
          )
        })
      })
    }

  })

}

shinyApp(ui, server)
Need local so that each item gets its own number. Without it, the value
# of i in the renderPlot() will be the same across all instances, because
# of when the expression is evaluated.
Is there a way to force immediate evaluation? Or at least a way to track the order?
hi, this is really helpful forum. been looking for this particular solution.
i applied the same function within the observeEvent to renderUI with textInput.
Trying to figure out now how I can monitor the user input from those dynamic textInput rendered.
Need also to use the inputs to update the plots rendered also from the same for loop within the observeEvent.
Appreciate your further help...
@wch Thank you for this code - it has been a lifesaver!
@ajnewcomb - Any data that depends on user input will need to be wrapped in a reactive() function, but your renderPlot() itself should not need to be.
Here is my code as an example:
for (num in 1:9)
{
  #without local, the filter and call to renderPlot will all get number 1
  local({
    local_num <- num

    #filter the data just to one week - needs to be reactive
    this_week <- reactive({
      filter(country_counts(), start_date == (unique(country_counts()$start_date)[local_num]))

    })

    this_plot <- paste("country_plot", local_num, sep = "")

    #plot each pie chart - NOT reactive
    output[[this_plot]] <- renderPlot({
      ggplot(this_week(), aes(x = "", y = unique_count, fill = aer_country)) +
      geom_bar(width = 0.5, stat= "identity" ) + coord_polar("y", start = 0)
    })
  })

}
In this case, my dataset 'this_week' is in a reactive function because it depends indirectly on the user's input in the dashboard. However, renderPlot is NOT in a reactive function because the call to it does not vary.
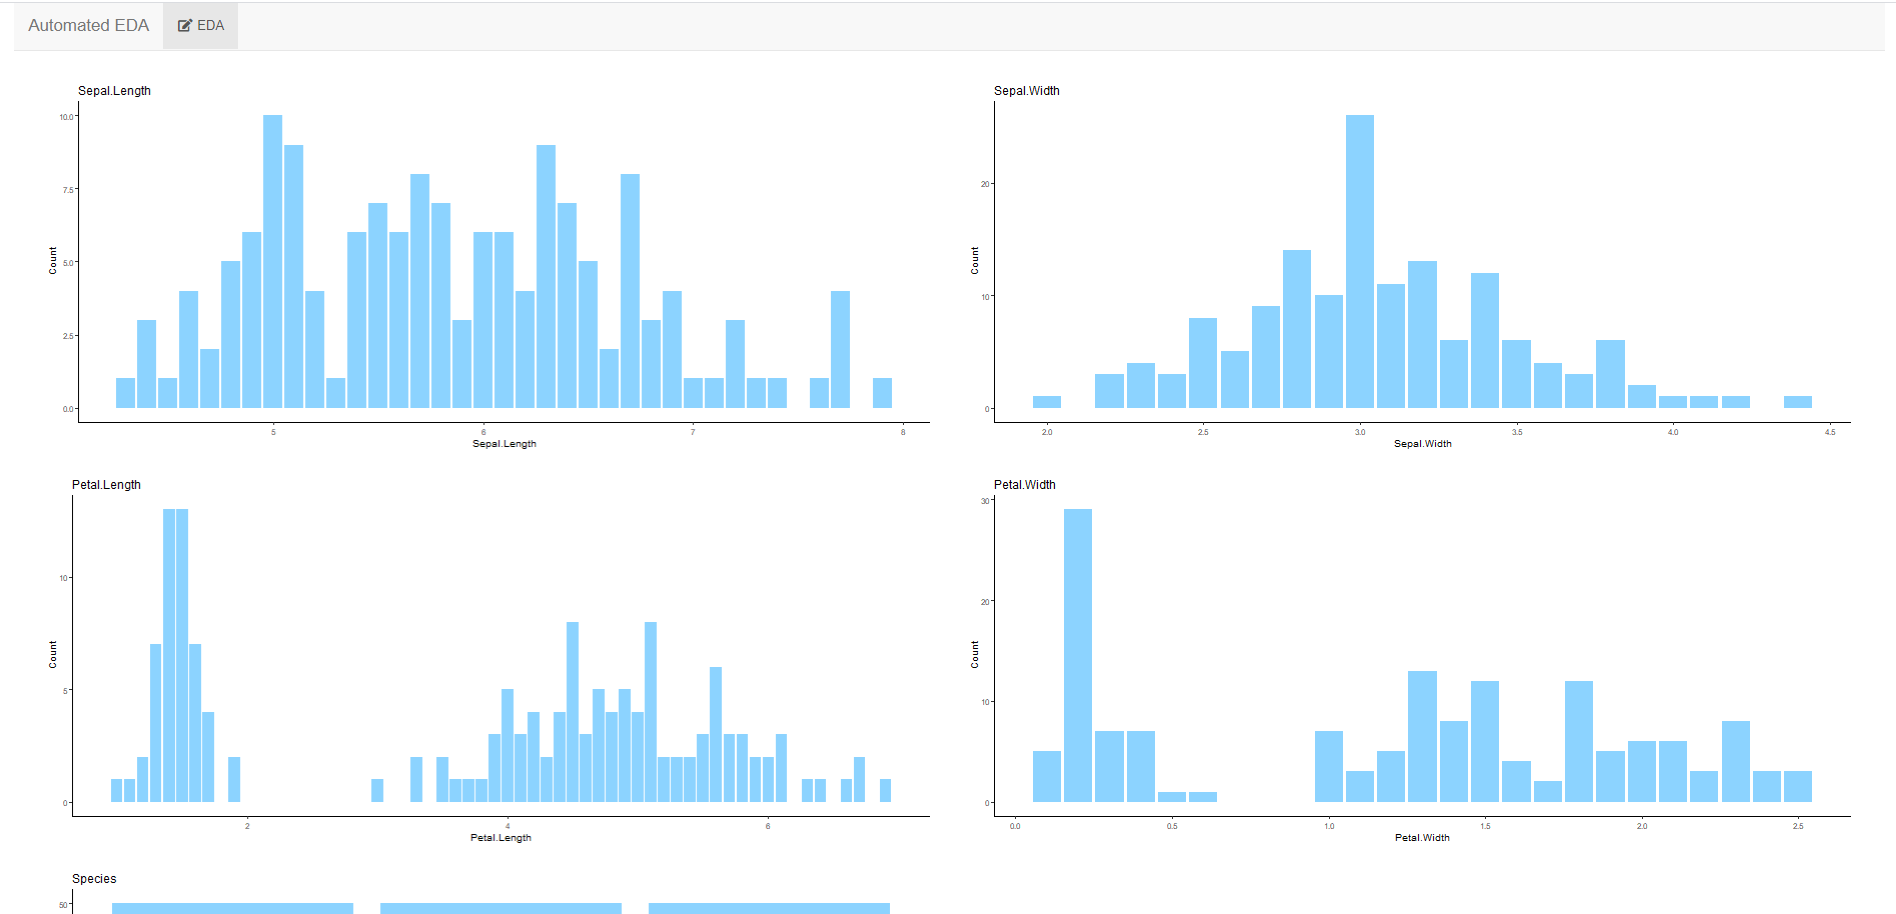
Not sure, who is still looking for a solution, but here is a snippet that I use.
Refer full code snippet at -
https://gist.github.com/mayank7jan/0e89c1d6f48379881da607140f45b2ac
  observeEvent(rv$data_filtered, {

    uniPlot <- lapply(names(rv$data_filtered), function(col_i){
      ggplot(rv$data_filtered, aes_string(x=col_i)) + geom_bar(fill = "#8cd3ff") + theme_classic() + labs(title = col_i) + xlab(col_i) + ylab("Count")
    })

    output$univariate_plots <- renderUI({

      plot_output_list <- lapply(seq_along(1:length(uniPlot)),function(plot_i){
        column(width = 6,
               tags$div(style = "margin-top: 10px; margin-bottom: 10px;",
                        plotOutput(outputId = paste0("uni_", plot_i))
               ))
      })

      # Convert the list to a tagList - this is necessary for the list of items to display properly.
      do.call(tagList, plot_output_list)

      ## either works
      # plot_output_list

    })

    rv$uniPlot <- uniPlot
  })

  observeEvent(rv$uniPlot,{

    lapply(seq_along(1:length(rv$uniPlot)), function(plot_i) {
      output[[paste0("uni_", plot_i)]] <- renderPlot({
        rv$uniPlot[[plot_i]]
      })
    })

  }, ignoreInit = FALSE)
Output Preview :
Thanks for these great solutions. I have two questions please: How to ensure that the plots have the same legend to compare for example. The second thing is how to save all generated plots with one button click. Thanks
Hi @intelligentica ,
-
The app then needs to then set to behave in a specific way only and lose some of its dynamicity. Or, Have tabs/select drop down for each of the columns in the uploaded data.frame to group/color by and thereby show the legend for.
-
To download all the generated plots with one click, there are multiple ways to do it -
- Knit all plots in a report with either or all formats - HTML, pdf or excel
- Have a download button for each plot
- Save all the dynamically generated plots to local memory and then zip the whole directory for download.
Each of these is doable since the dynamic plots produced are available as individual list items in plot_output_list
I wanted to add another use case to this excellent gist. In my case I wanted to generate a dynamic number of graphs based on the factor levels of a column from a user input file. See also https://stackoverflow.com/questions/75250661/generate-dynamic-number-of-plots-based-on-factor-levels-of-user-input-file/75251212#75251212
library(shiny)
library(data.table)
library(ggplot2)
library(dplyr)

ui <- fluidPage(

  headerPanel("Dynamic number of plots"),

  sidebarPanel(
    fileInput("fileIn",
              "Load input file",
              multiple = F)
  ),

  mainPanel(
    uiOutput("plot1")
  )
)

server <- function(input, output) {

  getData <- reactive({
    req(input$fileIn)
    dataIn <- as.data.frame(fread(input$fileIn$datapath))
    dataIn$plotGroup <- make.names(dataIn$plotGroup)
    return(dataIn)
  })

  output$plot1 <- renderUI({
    plotOutputList <- lapply(unique(getData()$plotGroup),
                             function(i){
                               plotname <- paste("plot", i, sep = "_")
                               plotOutput(plotname)
                             })
    do.call(tagList, plotOutputList)
  })

  observe({
  for(i in unique(getData()$plotGroup)){
    local({
      iCurrent <- i
      plotname <- paste("plot", iCurrent, sep = "_")

      output[[plotname]] <- renderPlot({
        getData() %>%
          filter(plotGroup == iCurrent) %>%
        ggplot(aes(x = xGroup, y = yVar)) +
          geom_point()
      })
    })
  }})
}

shinyApp(ui, server)
CAn output$plots <- renderUI({ part be inside observeEvent()?