Last active
November 15, 2018 03:48
-
-
Save wjakethompson/7239e991936d26206776dd44689e24fe to your computer and use it in GitHub Desktop.
R code for generating a ggclock
This file contains bidirectional Unicode text that may be interpreted or compiled differently than what appears below. To review, open the file in an editor that reveals hidden Unicode characters.
Learn more about bidirectional Unicode characters
| library(tidyverse) | |
| library(ggimage) | |
| logo <- "https://www.rstudio.com/wp-content/uploads/2014/06/RStudio-Ball.png" | |
| minutes <- data_frame(x = 0:60, y = 1) | |
| hours <- filter(minutes, x %% 5 == 0) | |
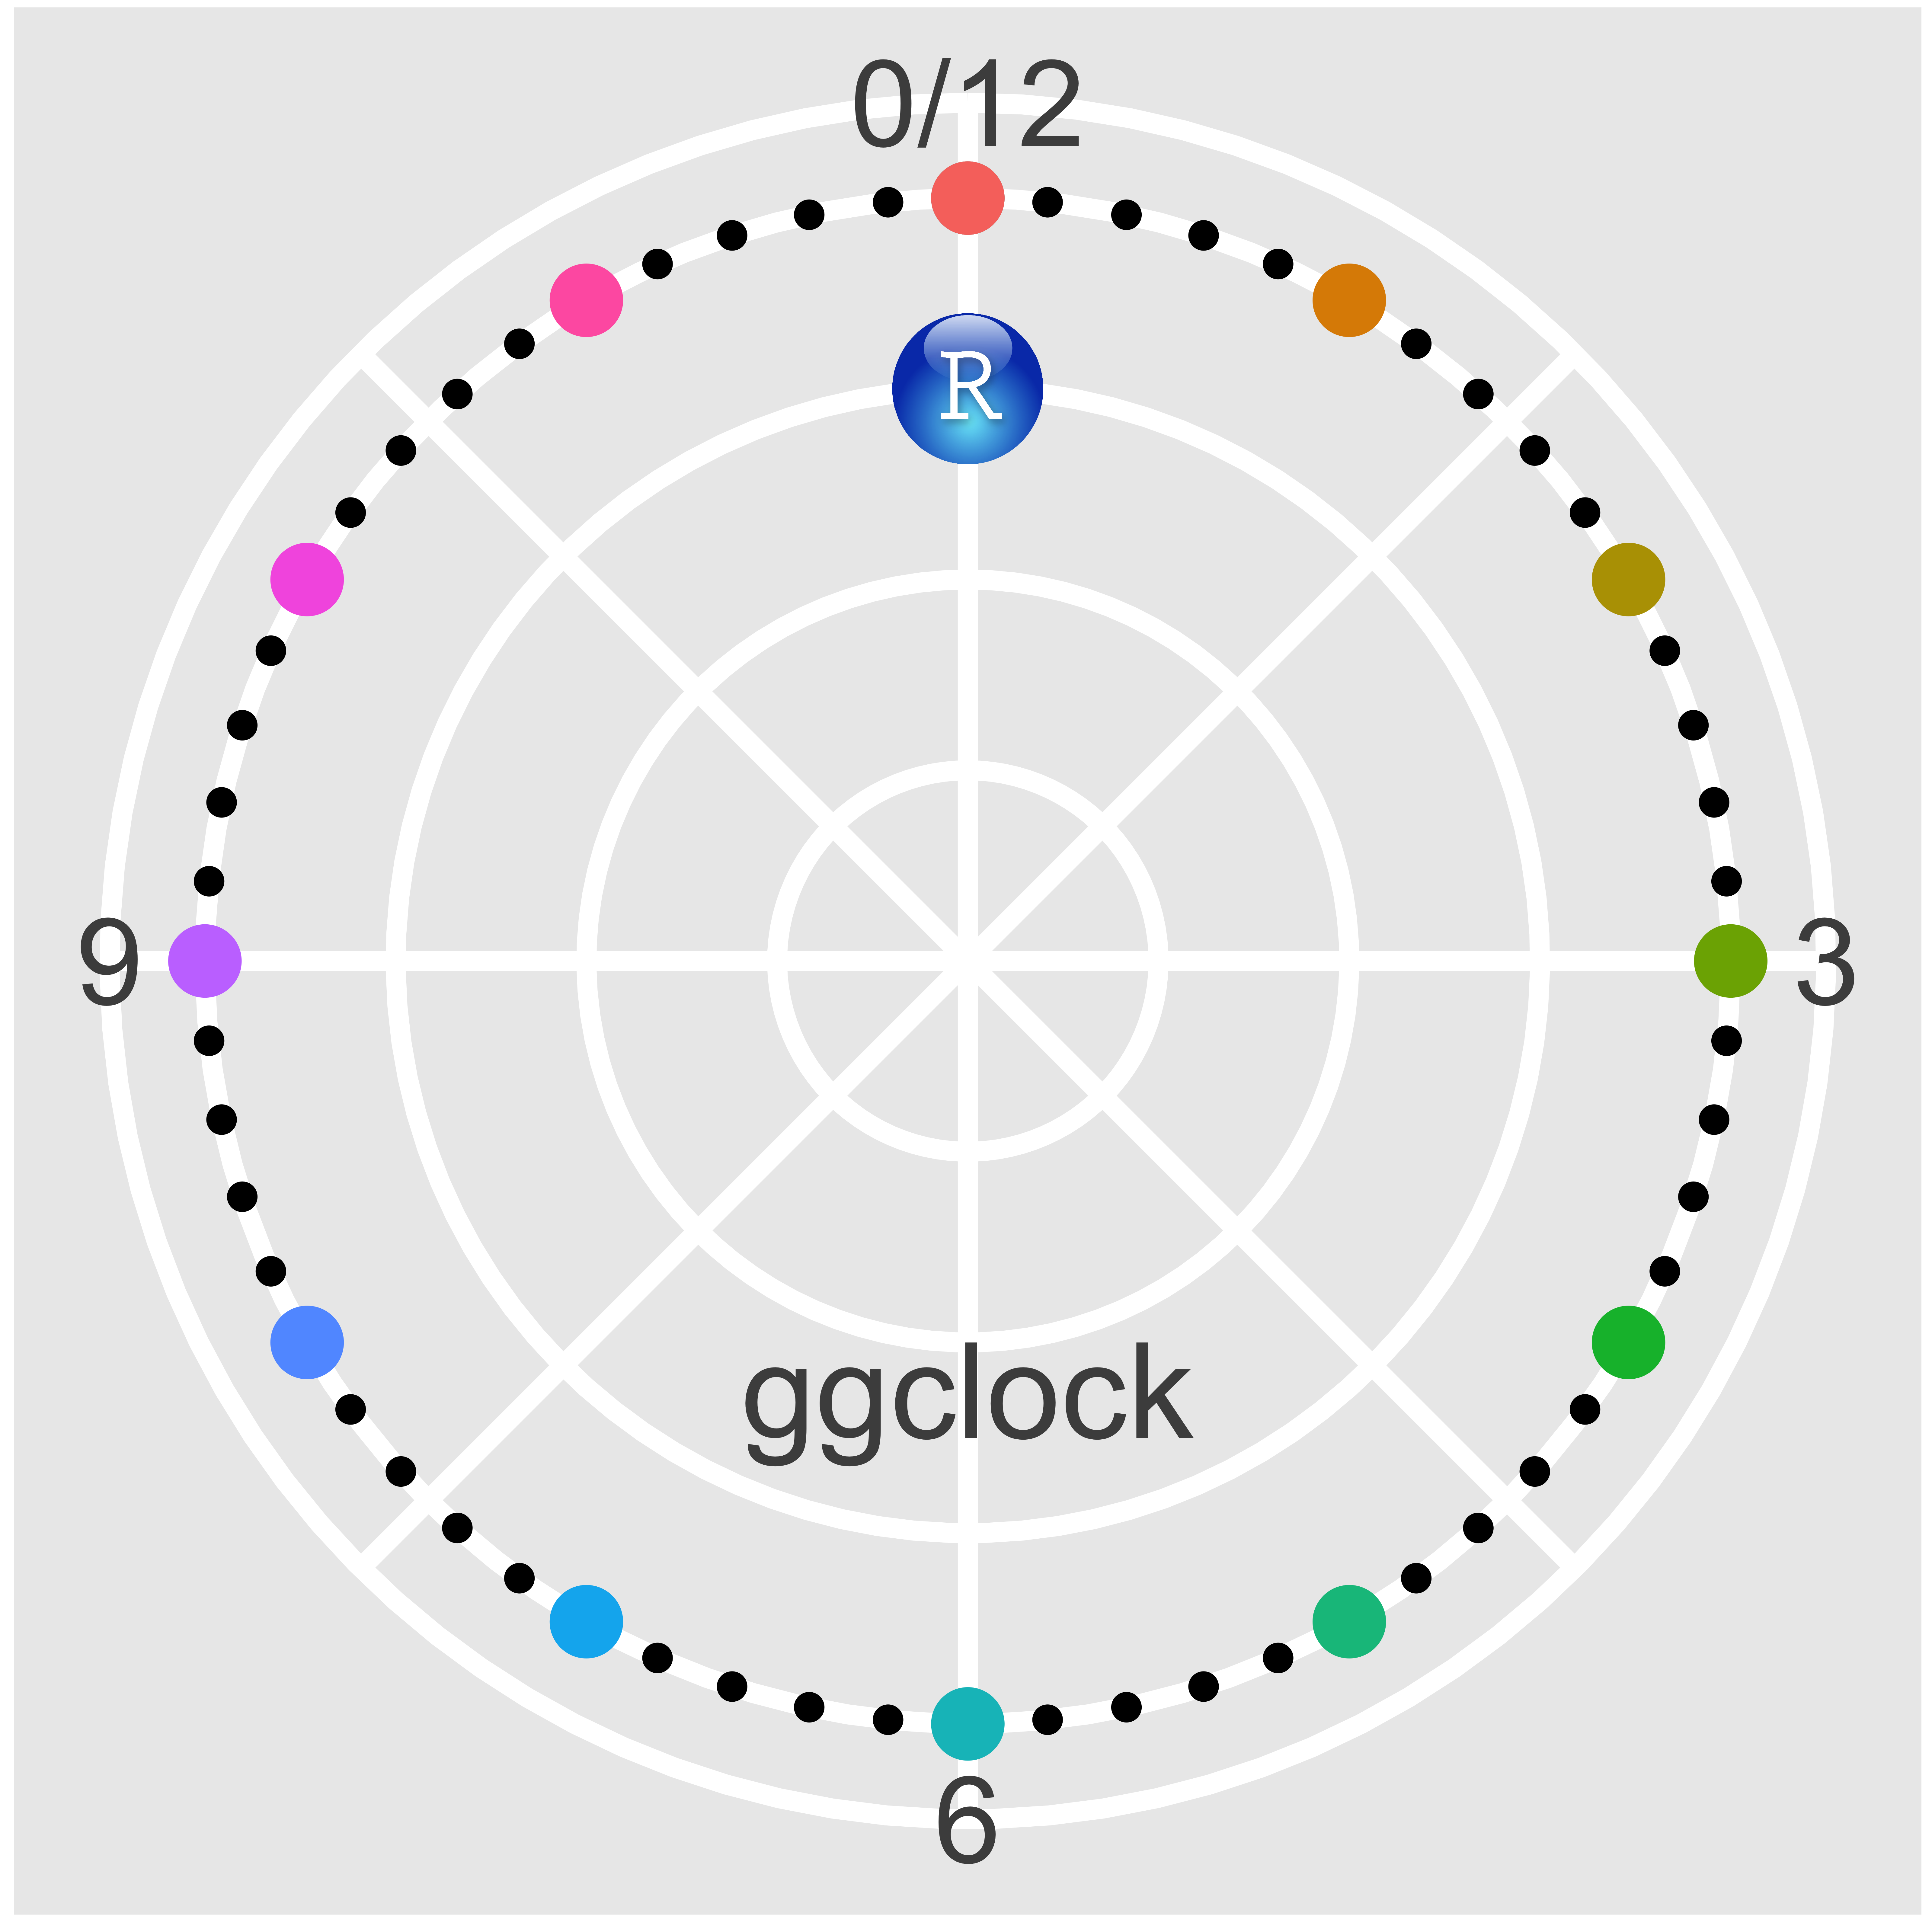
| ggplot() + | |
| geom_point(data = minutes, aes(x = x, y = y), size = 10) + | |
| geom_point(data = hours, aes(x = x, y = y, | |
| color = factor(x, levels = c(60, seq(5, 55, 5)))), | |
| size = 25, show.legend = FALSE) + | |
| geom_text(aes(x = 30, y = 0.5, label = "ggclock"), vjust = 1, size = 35, color = "grey30") + | |
| geom_image(aes(x = 60, y = 0.75, image = logo), size = 0.08) + | |
| coord_polar() + | |
| expand_limits(y = c(0, 1)) + | |
| scale_x_continuous(breaks = seq(15, 60, 15), labels = c(3, 6, 9, "0/12")) + | |
| scale_y_continuous(breaks = seq(0, 1, 0.25)) + | |
| scale_color_discrete() + | |
| theme_grey() + | |
| theme( | |
| axis.title = element_blank(), | |
| axis.ticks = element_blank(), | |
| axis.text.x = element_text(size = 90), | |
| axis.text.y = element_blank(), | |
| panel.grid.major = element_line(size = 7), | |
| panel.grid.minor = element_line(size = 7) | |
| ) -> ggclock_default | |
| ggsave("ggclock_default.png", plot = ggclock_default, path = "~/Desktop/", | |
| width = 20, height = 20, units = "in", dpi = "retina") | |
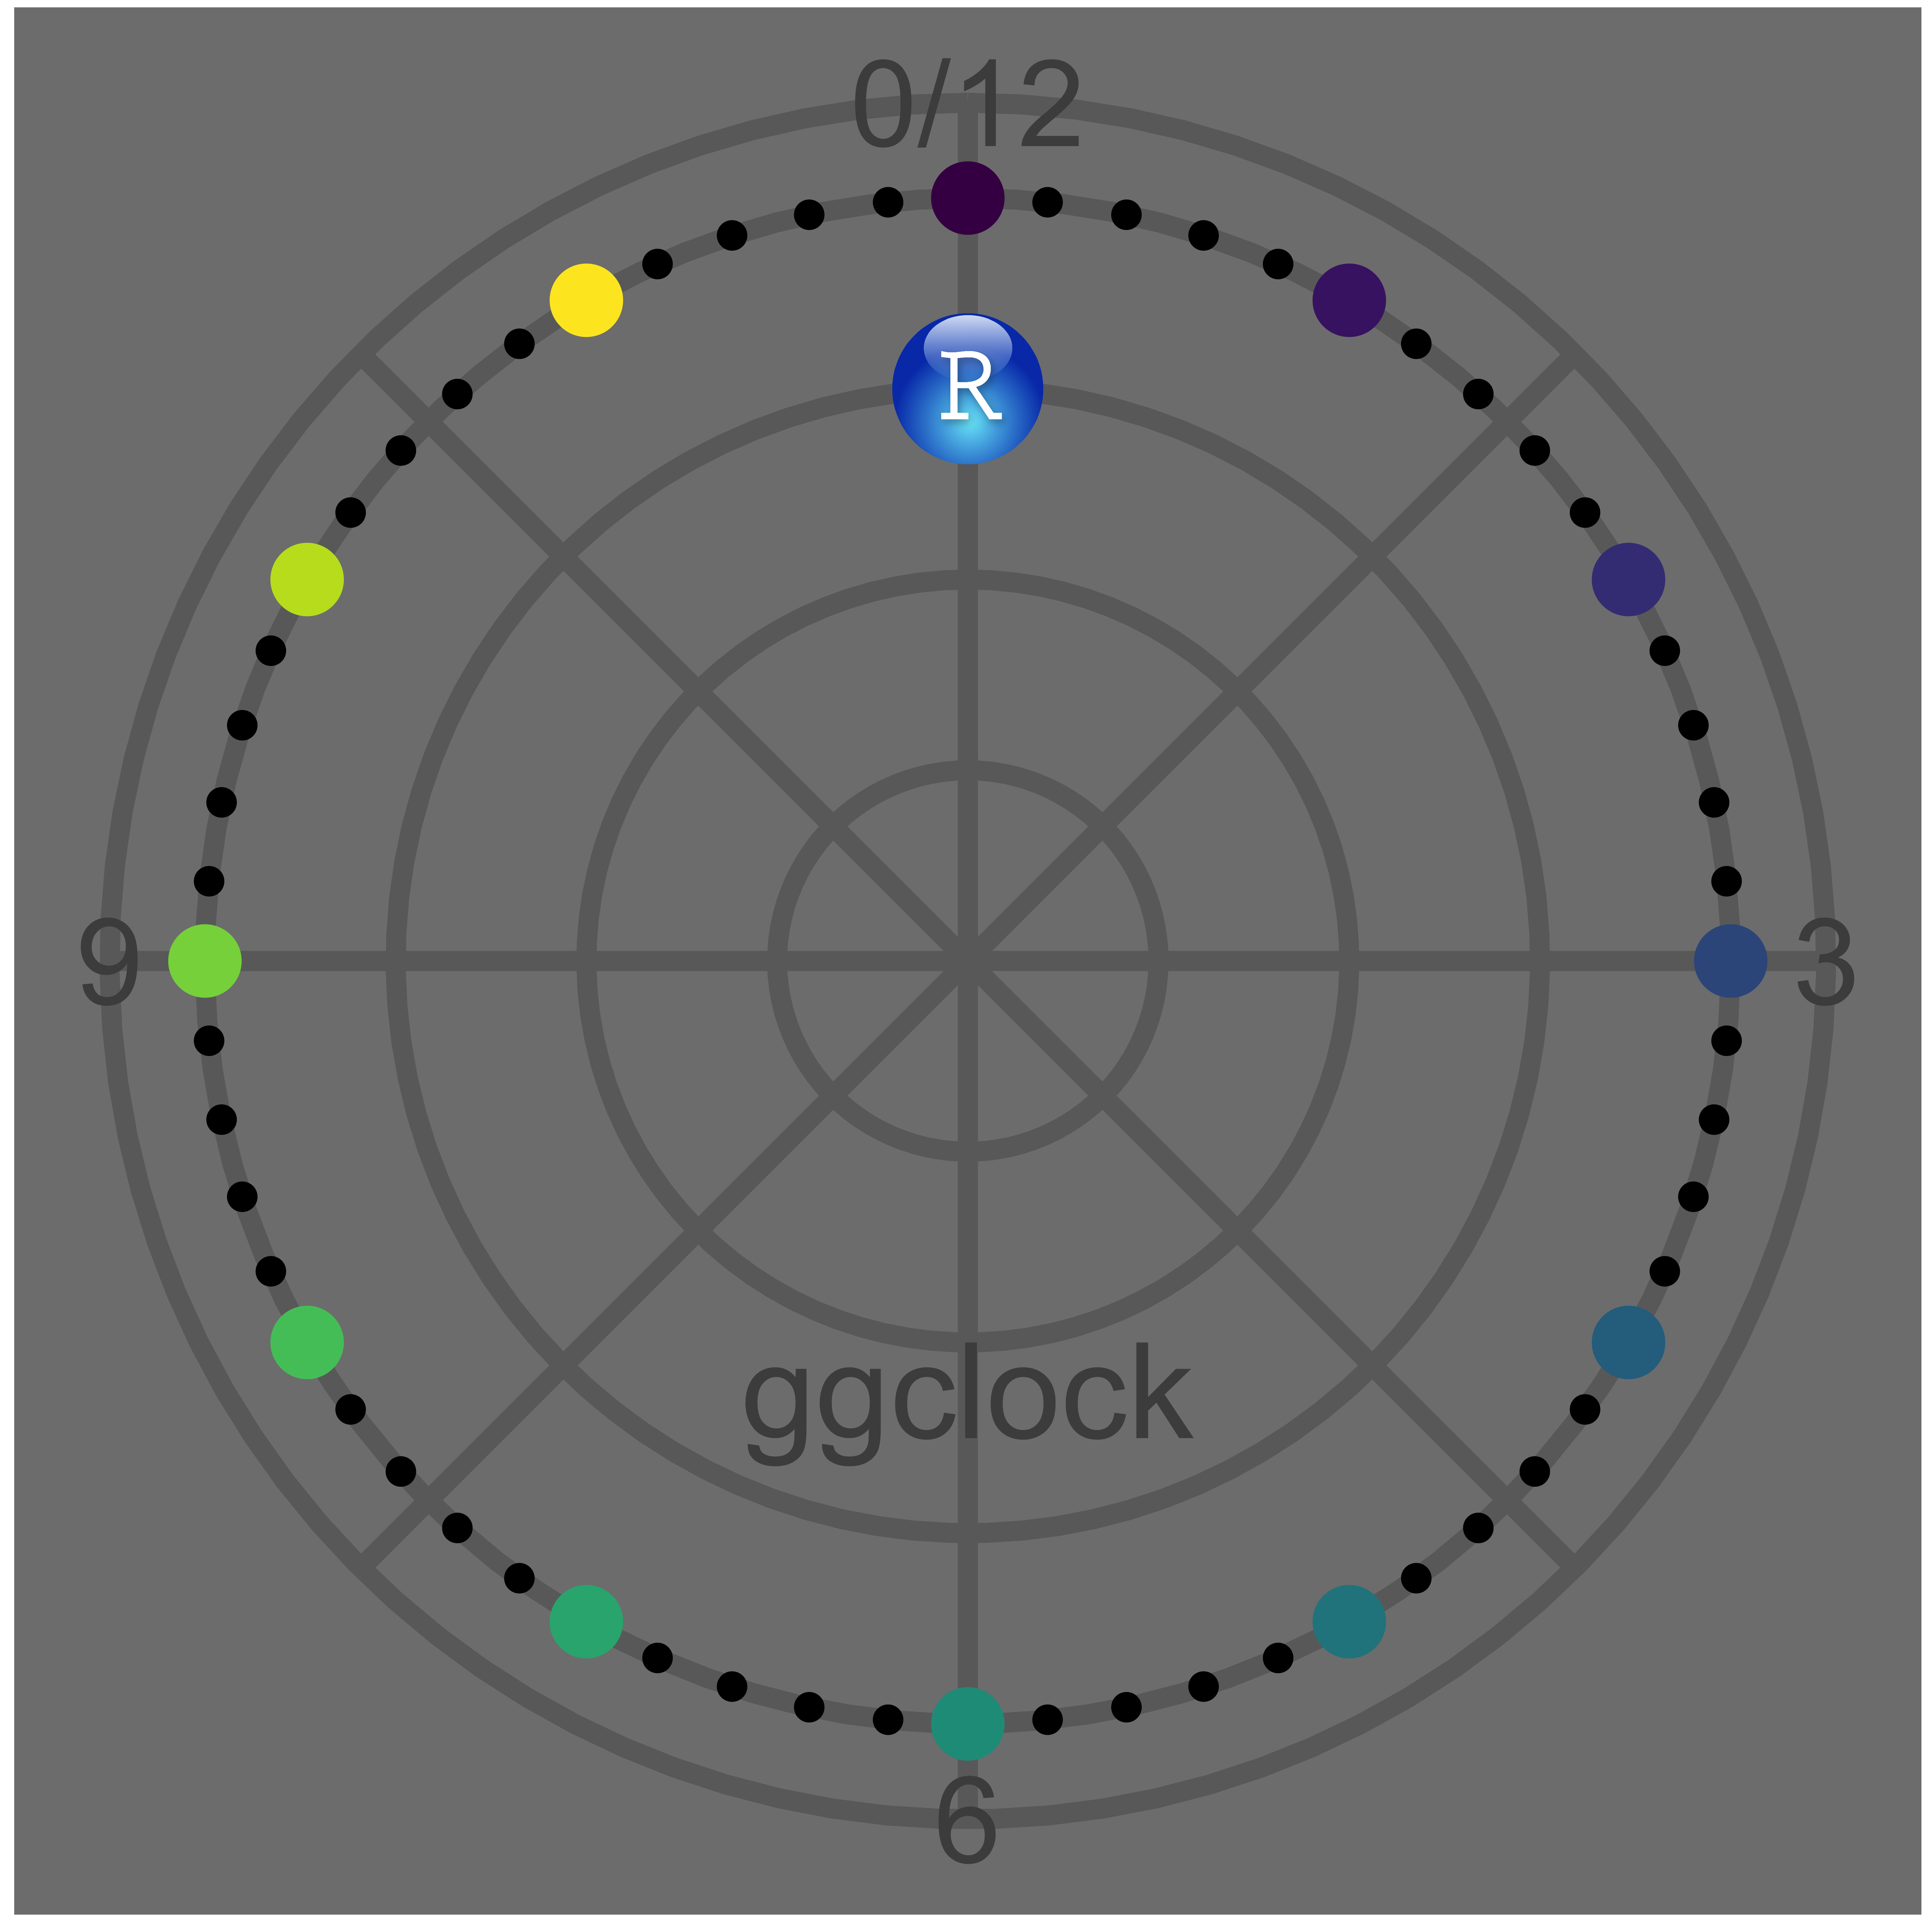
| ggplot() + | |
| geom_point(data = minutes, aes(x = x, y = y), size = 10) + | |
| geom_point(data = hours, aes(x = x, y = y, | |
| color = factor(x, levels = c(60, seq(5, 55, 5)))), | |
| size = 25, show.legend = FALSE) + | |
| geom_text(aes(x = 30, y = 0.5, label = "ggclock"), vjust = 1, size = 35, color = "grey30") + | |
| geom_image(aes(x = 60, y = 0.75, image = logo), size = 0.08) + | |
| coord_polar() + | |
| expand_limits(y = c(0, 1)) + | |
| scale_x_continuous(breaks = seq(15, 60, 15), labels = c(3, 6, 9, "0/12")) + | |
| scale_y_continuous(breaks = seq(0, 1, 0.25)) + | |
| scale_color_viridis_d() + | |
| theme_dark() + | |
| theme( | |
| axis.title = element_blank(), | |
| axis.ticks = element_blank(), | |
| axis.text.x = element_text(size = 90), | |
| axis.text.y = element_blank(), | |
| panel.grid.major = element_line(size = 7), | |
| panel.grid.minor = element_line(size = 7) | |
| ) -> ggclock_dark | |
| ggsave("ggclock_dark.png", plot = ggclock_dark, path = "~/Desktop/", | |
| width = 20, height = 20, units = "in", dpi = "retina") |
Author
wjakethompson
commented
Nov 15, 2018
Sign up for free
to join this conversation on GitHub.
Already have an account?
Sign in to comment