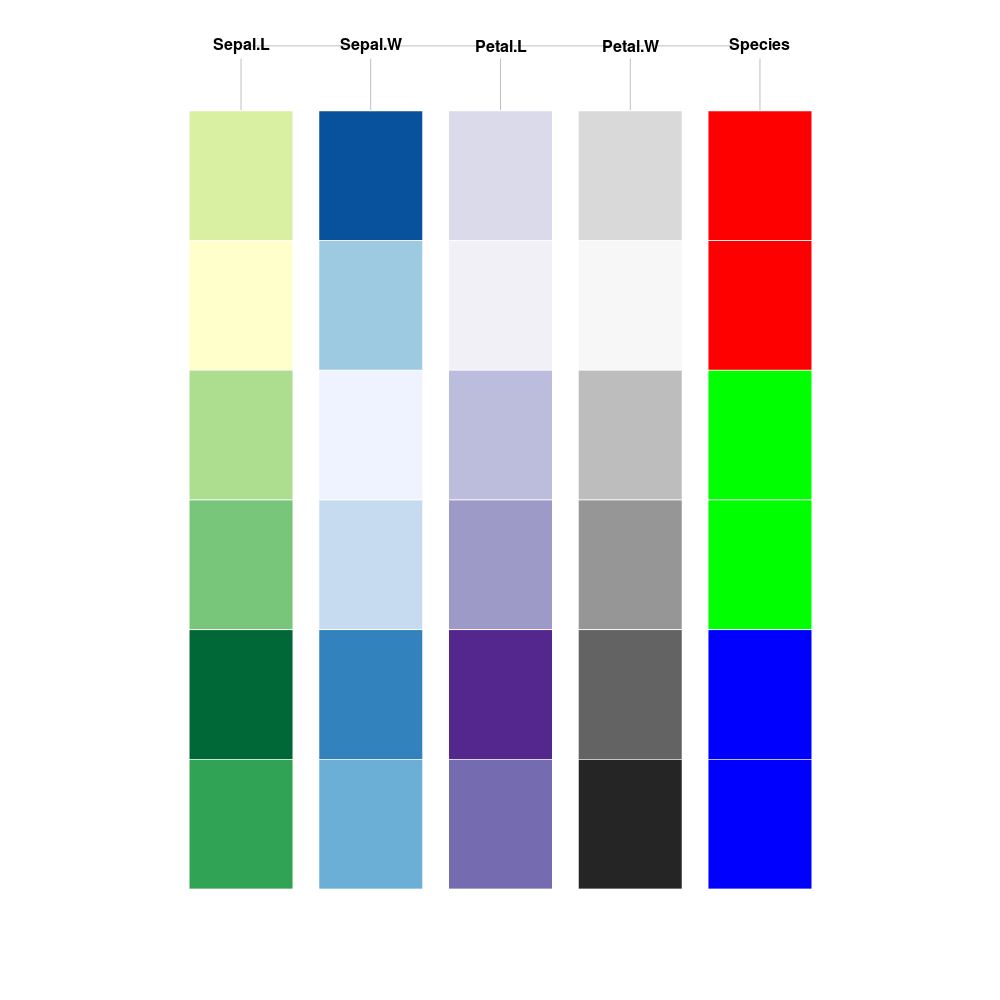
Having fun with Ramnath Vaidyanathan's new package rblocks!

woobe
/ index.html
Last active
August 29, 2015 14:02
[rChartsCalendar]: Points Scored by Paul George
This file contains bidirectional Unicode text that may be interpreted or compiled differently than what appears below. To review, open the file in an editor that reveals hidden Unicode characters.
Learn more about bidirectional Unicode characters
| <!doctype HTML> | |
| <meta charset = 'utf-8'> | |
| <html> | |
| <head> | |
| <link rel='stylesheet' href='http://cdn.jsdelivr.net/cal-heatmap/3.3.10/cal-heatmap.css'> | |
| <script src='http://d3js.org/d3.v3.min.js' type='text/javascript'></script> | |
| <script src='http://cdn.jsdelivr.net/cal-heatmap/3.3.10/cal-heatmap.min.js' type='text/javascript'></script> | |
| <style> |
This file contains bidirectional Unicode text that may be interpreted or compiled differently than what appears below. To review, open the file in an editor that reveals hidden Unicode characters.
Learn more about bidirectional Unicode characters
| library(rCharts) ## devtools::install_github("ramnathv/rCharts@dev") | |
| library(rPlotter) ## devtools::install_github("woobe/rPlotter") | |
| ## Using Theoph as the demo data. | |
| dat <- Theoph | |
| ## Initialise rCharts-parcoords | |
| p1 <- rCharts$new() | |
| p1$setLib(system.file('parcoords', package = 'rCharts')) |
This file contains bidirectional Unicode text that may be interpreted or compiled differently than what appears below. To review, open the file in an editor that reveals hidden Unicode characters.
Learn more about bidirectional Unicode characters
| ## Load Library | |
| library(rCrimemap) # devtools::install_github("woobe/rCrimemap") | |
| ## Create Crime Heatmap with Nokia map base | |
| r1 <- rcmap_quick(period = "2014-01", | |
| map_size = c(960, 500), | |
| provider = "OpenStreetMap.BlackAndWhite", | |
| zoom = 6) | |
| ## Save the Heatmap as a self-contained HTML |
woobe
/ Readme.md
Last active
August 29, 2015 14:06
— forked from timelyportfolio/Readme.md
This d3.js parallel coordinates plot is another experiment in how we might use interactive plots in Javascript to represent a partykit / rpart object from R. The example builds on this d3.js collapsible tree plot. Eventually, it would be nice to combine the tree and parallel coordinates into a layout with synced interactivity.
### Almost No [`rCharts`](http://rcharts.io) Also, this is fairly different from most of my interactive plots from R in that it almost completely avoids [`rCharts`](http://rcharts.io) (almost because I did use its `publish` to make this gist). I chose to exclude `rCharts` for two reasons:
- demo how we can use
htmltoolsto build html/js in R - help users understand some of the things
rChartsdoes f
This file contains bidirectional Unicode text that may be interpreted or compiled differently than what appears below. To review, open the file in an editor that reveals hidden Unicode characters.
Learn more about bidirectional Unicode characters
| ## Load package | |
| library(recharts) ## see https://github.com/taiyun/recharts | |
| ## Convert UKgas time series into a matrix | |
| mat_UKgas <- matrix(UKgas, ncol = 4, byrow = TRUE) | |
| rownames(mat_UKgas) <- rep(1960:1986, each = 1) | |
| colnames(mat_UKgas) <- c("Q1", "Q2", "Q3", "Q4") | |
| ## Create the echarts plot object | |
| e1 <- eArea(mat_UKgas, |
woobe
/ link_data.R
Last active
January 7, 2016 15:42
[Blog]: Things to try after useR! Part 1: Regularized Deep Learning with H2O
This file contains bidirectional Unicode text that may be interpreted or compiled differently than what appears below. To review, open the file in an editor that reveals hidden Unicode characters.
Learn more about bidirectional Unicode characters
| ## Convert Breast Cancer into H2O | |
| dat <- BreastCancer[, -1] # remove the ID column | |
| dat_h2o <- as.h2o(localH2O, dat, key = 'dat') | |
| ## Import MNIST CSV as H2O | |
| dat_h2o <- h2o.importFile(localH2O, path = ".../mnist_train.csv") |
woobe
/ h2o_save_load_model.R
Last active
June 14, 2017 15:39
An example of saving and loading H2O model in R
This file contains bidirectional Unicode text that may be interpreted or compiled differently than what appears below. To review, open the file in an editor that reveals hidden Unicode characters.
Learn more about bidirectional Unicode characters
| # Example: Saving and loading H2O models | |
| # Using Iris for this example | |
| d_train <- iris | |
| # Initialize H2O | |
| library(h2o) | |
| h2o.init(nthreads = -1) | |
| # Train a DRF model |
I created a function called "extract_colours()" in my "rPlotter" package. Using this function, any image in PNG, JPG, JPEG or TIFF format can be converted into a simple colour palette.
YET, this is my very first attempt, the colours are only sorted by alphabetical order at the moment. More work is needed to arrange colours based on colour theory and other factors.

OlderNewer