Last active
March 10, 2019 14:10
-
-
Save yogin16/3582b476210cfcf732e6d4f8985d18fe to your computer and use it in GitHub Desktop.
curve-fitting example
This file contains bidirectional Unicode text that may be interpreted or compiled differently than what appears below. To review, open the file in an editor that reveals hidden Unicode characters.
Learn more about bidirectional Unicode characters
| """ | |
| The code is implementation of techniques in this lecture: https://www.essie.ufl.edu/~kgurl/Classes/Lect3421/Fall_01/NM5_curve_f01.pdf | |
| """ | |
| import matplotlib.pyplot as plt | |
| import numpy as np | |
| def curve(X, Y, order): | |
| sigma_x=[] | |
| for i in range(2*order + 1): | |
| if i==0: | |
| ans=len(X) | |
| else: | |
| ans=0 | |
| for x in X: | |
| ans += x ** i | |
| sigma_x.append(ans) | |
| print(sigma_x) | |
| sigma_xy=[] | |
| for i in range(order + 1): | |
| ans = 0 | |
| for index in range(len(Y)): | |
| x = X[index] | |
| y = Y[index] | |
| ans += (x ** i)*y | |
| sigma_xy.append(ans) | |
| print(sigma_xy) | |
| A=[] | |
| for i in range(order + 1): | |
| A.append(sigma_x[i:(i + order + 1)]) | |
| numA = np.array(A) | |
| print(numA) | |
| numB = np.array(sigma_xy) | |
| coeff = np.dot(np.linalg.inv(numA),numB) | |
| print(coeff) | |
| ## coeff matrix is our answer - creating sample data to plot the function for the polynomial below: | |
| sample_x = np.linspace(0,6,20) | |
| x_arr = [] | |
| for sample in sample_x: | |
| pol = [] | |
| for i in range(order + 1): | |
| pol.append(sample ** i) | |
| x_arr.append(pol) | |
| numSampleX = np.array(x_arr) | |
| sample_y = np.dot(numSampleX, coeff) | |
| print(sample_x) | |
| print(sample_y) | |
| plt.plot(sample_x, sample_y) | |
| if __name__ == '__main__': | |
| size = 4 | |
| def generate_data(size): | |
| x = np.array(np.random.rand(size,)) | |
| y = 8 * (x**2) + 8*x + 5 | |
| return x,y | |
| X,Y = generate_data(size) | |
| order=2 | |
| plt.plot(X, Y, 'ro') | |
| for i in range(1,order+1): | |
| curve(X, Y, i) | |
| plt.show() |
Sign up for free
to join this conversation on GitHub.
Already have an account?
Sign in to comment
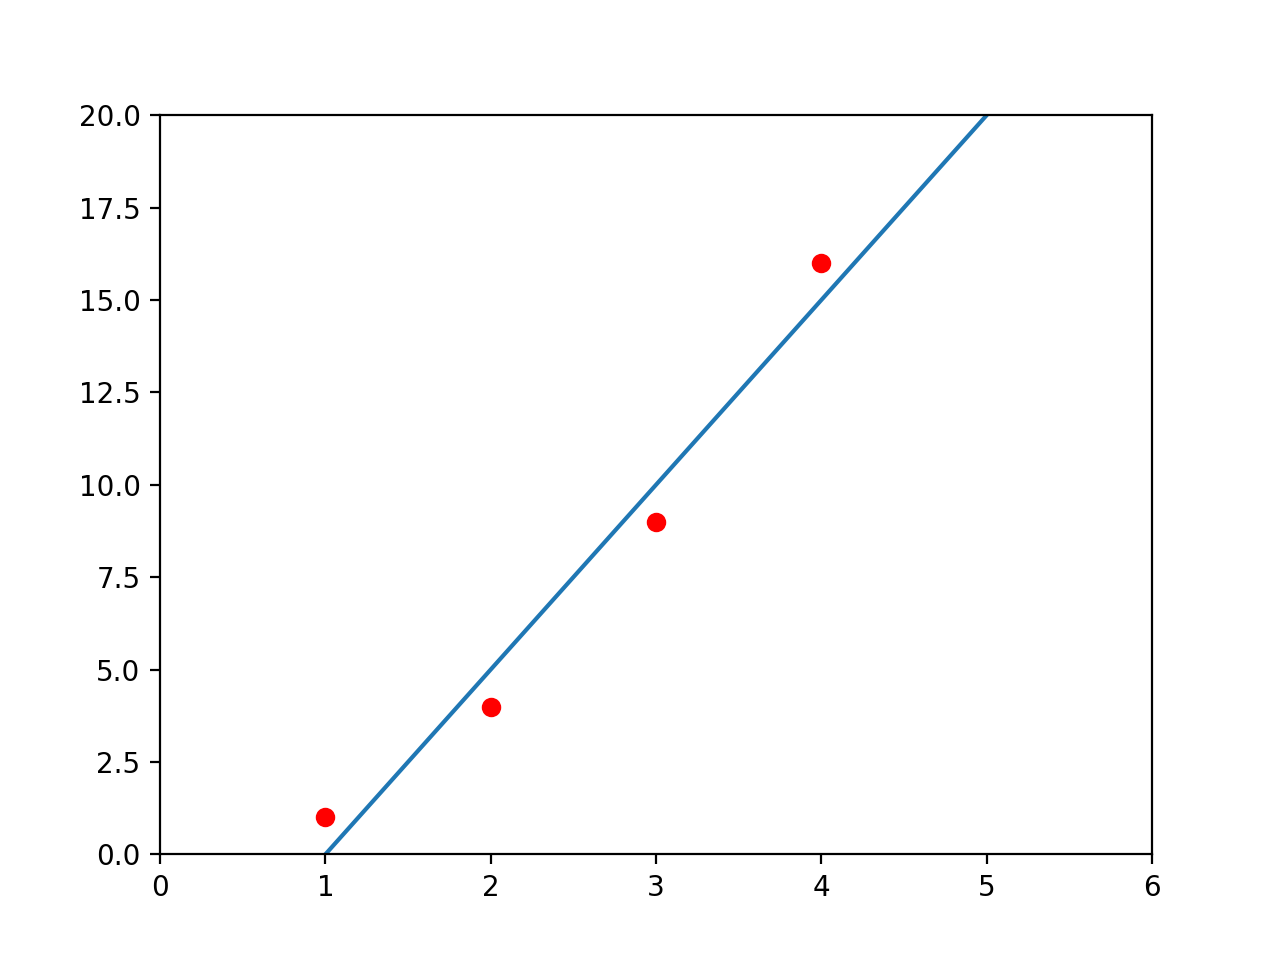
Fitting to Order 1 polinomial:

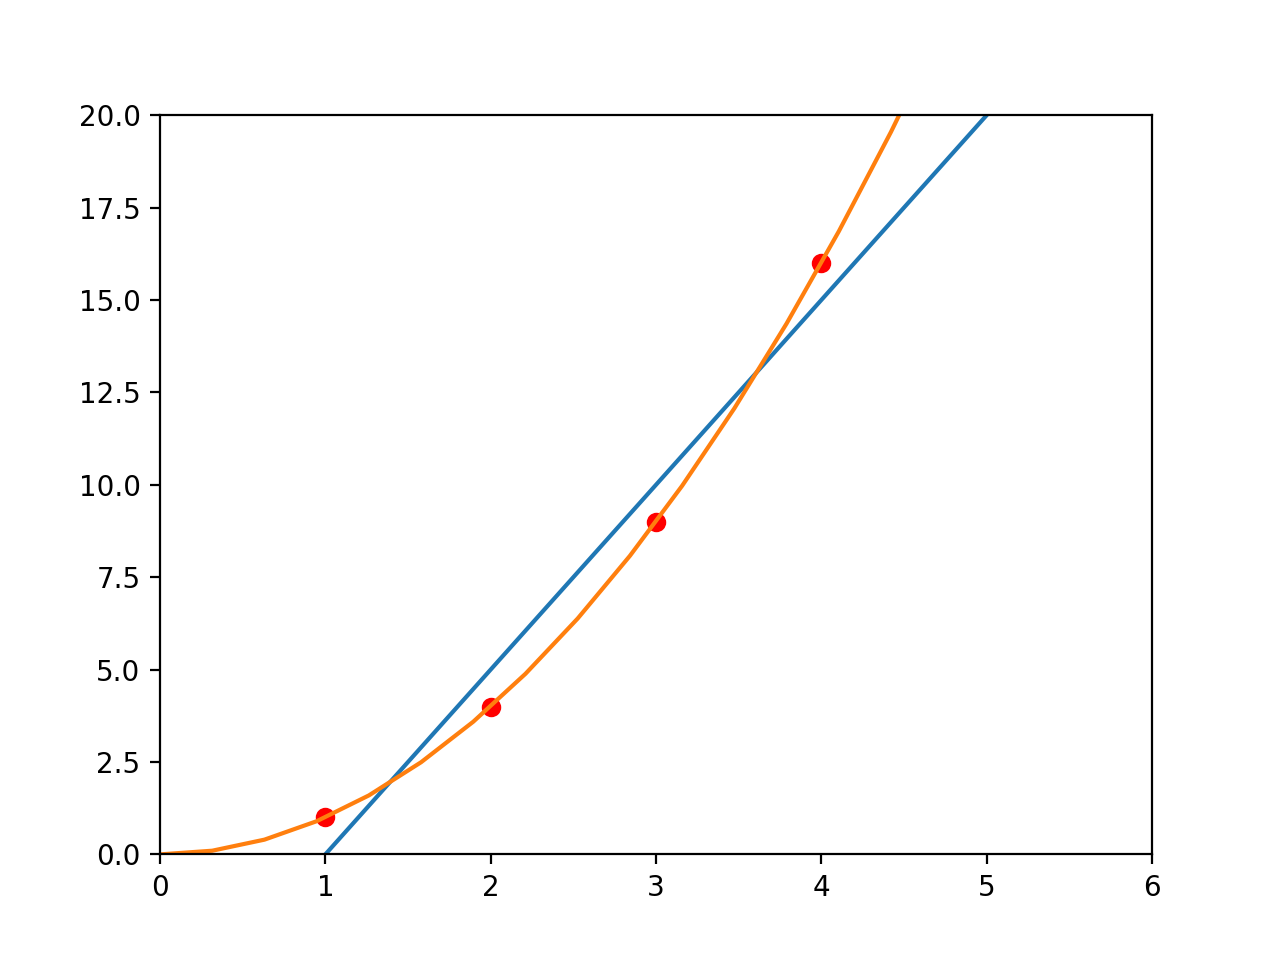
Fitting to Order 2 polinomial:
