Last week, you trained an image classifier with modern machine learning methods to achieve state-of-the-art results, making use of transfer learning from the ImageNet dataset, which was collected with large-scale crowdsourcing.
AI encodes and magnifies bias, and Google researchers found that ImageNet and another popular dataset called Open Images "appear to exhibit an observable amerocentric and eurocentric representation bias," as demonstrated by the distribution of geographically identifiable images in the datasets, with 2/3 of the images from the Western world.
In addition, classifiers trained on the datasets show "strong differences in the relative performance on images from different locales", with lower accuracy and confidence on images with labels related to people, like "bridegroom" and "police officer", from countries like India and China. The research helped inspire the Inclusive Images Challenge, run by Google in partnership with a top deep learning conference called NeurIPS, last year.
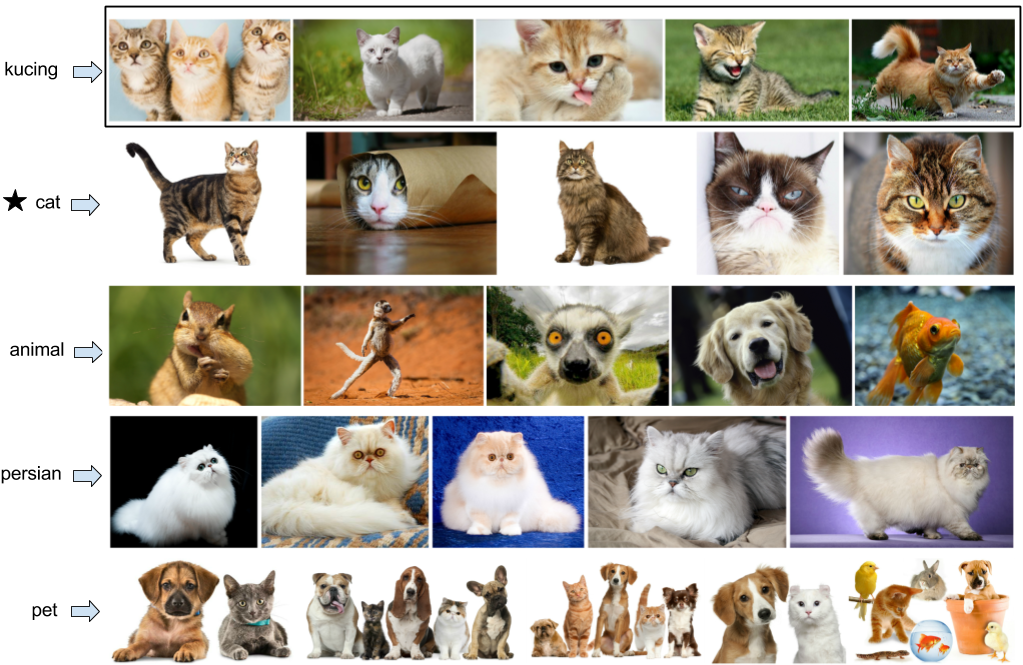
A different large-scale crowdsourced dataset, The Massively Multilingual Image Dataset (MMID), was created by Penn researchers to learn English translations for words in 100 foreign languages, by scraping images for each foreign word and finding the English words that had the most "similar" images.
MMID contains around 100 images for around 10,000 words in 100 foreign languages, providing an interesting source of data for improving the "geodiversity" of image classifiers. However, the images for an English translation of a foreign word can be noisy, as shown by crowdworkers who evaluated the relevance of images for a large subset of translations for 3 languages.
In this assignment, you will explore how a classifier pre-trained on ImageNet perform on photos representing wedding-related words in several Indian languages, and employ Indian workers on Mechanical Turk to validate that images are in fact related to "groom/bridegroom".
-
In a Colab notebook with a GPU runtime (Runtime -> Change runtime type -> Hardware accelarator -> GPU), follow the Keras code to Classify ImageNet classes with ResNet50 on a wedding image you download from Google Images and upload to Colab, to get a feel for the code. Keras is a high-level neural networks library that makes it easy to run pre-trained models.
-
Upload the zipped "Weddings Indian Languages" dataset to Colab and run
!unzip "weddings-indian-languages.zip"in a new cell. The dataset is composed of around 200-1000 images per language, for 7 languages spoken in India (Bengali, Gujarati, Hindi, Malayalam, Marathi, Punjabi, Tamil, and Telugu), taken from MMID. -
Create a DataFrame from a list of dictionaries, where each dictionary contains the results of the classifier on an image, and looks like
{"path": "weddings-indian-languages/hindi/6250/07.jpg", "predictions": ["vestment", "kimono", "theater_curtain"], "predictions_include_groom_or_bridegroom": False}. We recommend using the glob module with wildcards to get a list of all the images. Save the DataFrame asimage_paths_and_predictions.csv, which you will use later in the assignment. To simplify step 7, you must add "https://s3.amazonaws.com/nets213-hw5/" to the beginning of each image file path, before saving it as a CSV. -
In the Amazon MTurk Requester site, sign in to create a new project from the "Other" template. The task you are creating is to get workers in India to click on images that represent the word "groom/bridegroom".
-
Enter the properties of the HIT using the best practices you learned from class - we recommend $0.02 per HIT (for an hourly wage of around $3.6) and 3 assignments per task (for quality control). Under "Worker Requirements", you MUST add the criterion that the location of workers is India.
-
Use the provided design layout and preview the HIT. Download a sample of the input CSV file for the project at the top of the page, and finish creating the HIT.
-
Use the sample
input.csvfile format andimage_paths_and_predictions.csv(created in step 3) to createvariables.csvwith the right format for the HIT. The English word we care about is "groom/bridegroom". -
Click "Publish Batch" in MTurk, uploading
variables.csv, and preview the tasks. Click "Next" and confirm the settings of your HIT, which should cost approximately $30 per team. Sit back and watch the crowd work! -
When the HIT is done, download the Batch CSV and read it into a DataFrame. For every row in the DataFrame, split "Answer.selected" to get the the images that workers identified as "groom/bridegroom". For each such image in the row (Input.image), if image is in the selected images, update the counter, where the key is the URL in the Input.image column. Here is the pseudocode:
Create a Counter object c
For every row in the DataFrame:
     true_images = the list from splitting the string in the "Answer.selected" column of the row by "|"
     for every image{i} in the images:
          if image{i} in true_images:
               url = row["Input.image{j}"]
               c[url] += 1
- Create a DataFrame from the counter, and derive a new column that is True only if the counter value is 2 or more (a majority of the workers said the image represented "bride/bridegroom"). Use the merge function to join the DataFrame from
image_paths_and_predictions.csvto the DataFrame of true labels, on the column of image paths. Save the DataFrame assubmissions.csv. Calculate the percentage of images the classifier predicted to be about "groom/bridegroom" (positives), and calculate the rate of images that the classifier missed the presence of "groom/bridegroom" (false negatives). Are you surprised by the results you got? Explore the results further by visualizing images that the classifier (in)correctly labeled.
Below are the questions that you will be asked to answer about this assignment. Please turn in your answers in a PDF for Homework 5 on Gradescope.
- What is the link to your Colab notebook?
- Attach a screenshot of the page confirming the settings of the HIT.
- What is the rate of positives and false negatives?
- Analyze how the predictions of the classifier compare to the labels of the workers. Include images to explain why the classifier correctly or incorrectly labels certain images.
- If you had more time to work on this HIT, what additional steps would you add to include better quality control and aggregation?
- Upload
submissions.csv.


