postgres: update a column based on another column
UPDATE income
SET currency = 'HRK'
WHERE income.date < '2022-01-01';UPDATE income
SET currency = 'HRK'
FROM parties
WHERE income.party_id = parties.id
AND parties.country = 'HR'
AND income.date < '2022-01-01';pycountry and pycountry_convert - country details
To cycle through the list, you can use the modulo operator: L[i % n]
computer_rooms = ["2.08","2.09","2.1"]
[computer_rooms[i % len(computer_rooms)] for i in range(10)]
# ['2.08', '2.09', '2.1', '2.08', '2.09', '2.1', '2.08', '2.09', '2.1', '2.08']The re.findall(pattern, string) method scans string from left to right, searching for all non-overlapping matches of the pattern. It returns a list of strings in the matching order when scanning the string from left to right.
import re
s = '111A222B333C'
res = re.findall('(\d+|[A-Za-z]+)', s)
print(res)
# ['111', 'A', '222', 'B', '333', 'C'][item for sublist in listoflists for item in sublist]has_tail = ["cat", "dog", "chameleon"]
has_earlobes = ["human", "cat", "dog"]
list(filter(set(has_tail).__contains__, has_earlobes))
>> ['cat', 'dog']object.as_dict(){y:x for x,y in stations.items()}# unPythonic
if season == 'Winter':
holiday = 'Christmas'
elif season == 'Spring':
holiday = 'Easter'
elif season == 'Summer':
holiday = 'American Independence Day'
elif season == 'Fall':
holiday = 'Halloween'
else:
holiday = 'Personal day off'
# Pythonic
season = "Winter"
holiday = {'Winter': 'Christmas',
'Spring': 'Easter',
'Summer': 'American Independence Day',
'Fall': 'Halloween'}.get(season, 'Personal day off')
season
"Christmas"workDetails = {}
# unPythonic
if 'hours' in spam:
hoursWorked = workDetails['hours']
else:
hoursWorked = 0 # Default to 0 if the 'hours' key doesn't exist.
# Pythonic
hoursWorked = spam.get('hours', 0)
# Pythonic 2
workDetails.setdefault('hours', 0) # Does nothing if 'hours' exists.keys = ['a', 'b', 'c']
values = [1, 2, 3]
dictionary = dict(zip(keys, values))datetime.date.fromisoformat('string')datetimeObject.isoformat()replace br with a different character
for br in soup.find_all('br'):
   br.replace_with("|")
import pandas as pd

from IPython.display import Markdown, display

def printmd(string):
    display(Markdown(string))

import gspread
import gspread_dataframe as gd
from oauth2client.service_account import ServiceAccountCredentials

pd.set_option("max_colwidth", 500)
pd.options.display.max_rows = 100
pd.options.display.max_columns = 100
pd.options.display.float_format = '{:,.2f}'.formatNot a column, but just one value
pd.isna(df["colname"][0])Hence filling in a column only where there is NaN values based on a dictionary
dict = {"key" : "value"}
x["different_col"] * dict[x["somecolthat_holds_the_keys"]] if pd.isna(x["colname"]) else x["colname"]Series.astype(int)returns a Series source
df.count() / len(df)
df.notnull().mean().round(4) * 100returns a list of columns
cutoff = 50 # percent of not null
filter_columns = df.notnull().mean().round(4) * 100
filter_columns.where(filter_columns > cutoff).dropna().indexIf an item from somecol is in the list, assign value 1 to a new column in the DataFrame, if not assign a 0
list = [items, items, items]
df["newcol"] = [1 if y in list else 0 for y in df["somecol"]]result is a matrix
Group           Size

Short          Small
Short          Small
Moderate       Medium
Moderate       Small
Tall           Large

pd.crosstab(df.Group,df.Size)df.groupby("col")["jointhis"].agg(lambda col: ', '.join(col))
df.groupby("col")["jointhis"].apply(list)df.groupby("colname").cumcount() + 1 # +1 because otherwise counting starts at 0
colname1 | cumcount
a | 1
a | 2
b | 1
a | 3
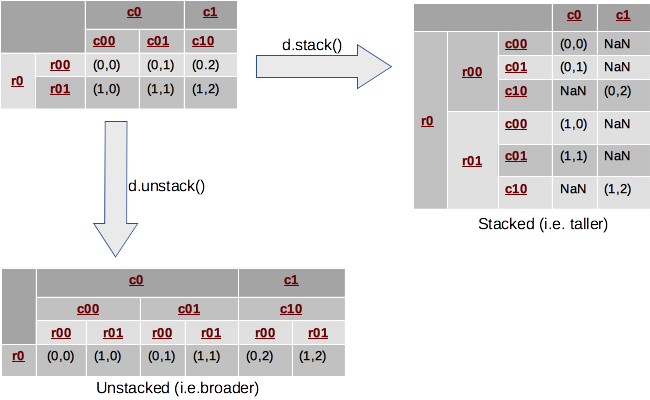
c | 1perc = pd.DataFrame(df.apply(lambda x: 100 * (x / float(x.sum())))).unstack()
# perc.columns = perc.columns.droplevel()import json
import requests
r = requests.get("https://api.tenders.exposed/networks/58d77f85-bbc6-447d-a292-c3f17b7936b0/").text
data = json.loads(r)
# go down the tree as far as you need
data["network"]["nodes"]
# normalize that baby
pd.json_normalize(data["network"]["nodes"])map_min = {"Ministerie van Economische Zaken, Landbouw en Innovatie" : "Ministerie van Economische Zaken",
"Provincie Overrijssel" : "Provincie Overijssel"}
nl = nl.replace({'Overheid': map_min}) # "Overheid" is the column namefrom fuzzymatcher import link_table, fuzzy_left_join
fuzzy_left_join(df1, df2, "df1-matchingcol", "df2-matchingcol")exploded = df[["id","colname"]].set_index("id")["colname"].str.split(";").explode().reset_index().drop_duplicates()
pd.merge(left=df, right=exploded, on="id")def highlight_max(s):
'''
highlight the maximum in a Series yellow.
'''
is_max = s == s.max()
return ['background-color: yellow' if v else '' for v in is_max]
df.style.apply(highlight_max)df.style.bar()
df.style.background_gradient(cmap='Blues', axis=None)https://github.com/robin900/gspread-formatting
import pandas as pd
import gspread
from oauth2client.service_account import ServiceAccountCredentials

scope = ['https://spreadsheets.google.com/feeds', 'https://www.googleapis.com/auth/drive']
creds = ServiceAccountCredentials.from_json_keyfile_name('the_credentials.json', scope)
client = gspread.authorize(creds)

url = "sheeturl"

sheet = client.open_by_url(sheet_url)

# entities = gd.get_as_dataframe(sheet.worksheet("sheetnamen"),  skiprows=1) # get a sheet
# entities = entities.dropna(axis=0, how="all").dropna(axis=1, how="all") # remove empty rows and columns
#gd.set_with_dataframe(sheet.worksheet("sheetnamen"), entities, row=2) # push to a sheetall_csvs = glob.glob("/data/*.csv")
cols = ["col1", "col2"]
df = pd.concat((pd.read_csv(table,
usecols=cols,
delimiter=';', low_memory=False) for table in all_csvs), ignore_index=True)zf = zipfile.ZipFile("zippedcsvs.zip")
#zf.infolist()
df = pd.concat((pd.read_csv(zf.open(text_file.filename), encoding = "ISO-8859-1") for text_file in zf.infolist() if text_file.filename.endswith('.csv')))
from pyexcel_ods import get_data

sheet = get_data("data.ods")["sheetname"]
df = pd.DataFrame(sheet)
df.columns = df.iloc[0]
df = df[1:]lol = df.values.tolist()use one column as key and another as value
df.set_index('colname').T.to_dict('records')df.Turl = "https://www.web.com/"
path = "naeme.png"
driver = webdriver.Firefox()
driver.get(url)
time.sleep(5)
el = driver.find_element_by_tag_name('body')
el.screenshot(path)
driver.quit()np.where(((df["col1"] == "pink") &
(data["col2"] == "pink")) |
((data["col1"] == "blue") &
(data["col2"] == "blue")), "same", "not")Use when data is next to each other rather than below
dfs = np.split(df, 12, axis=1)alt.data_transformers.enable('default', max_rows=None)column = is the nominal column we count on.
if sum, ...
alt.Chart(df).mark_bar().encode(
    x = "count(column):Q",
    y = alt.Y(
        'column:N',
        sort=alt.EncodingSortField(
            field="column",  # The field to use for the sort
            op="count",  # The operation to run on the field prior to sorting
            order="descending"  # The order to sort in
        ))
)- Horizontal grouped bar chart
- labelAngle 0 is probably bugged. 0.1 works well
row = alt.Row("parameter", header=alt.Header(labelAngle = 0.1))color = alt.Color('variable',
scale=alt.Scale(
domain=['good', 'medium', 'bad'],
range=['blue', 'yellow' ,'red']))alt.Chart(df).transform_calculate(
url=alt.datum.colname
).mark_circle().encode(
x = "col1",
y = "col2",
href='url:N',LOAD CSV WITH HEADERS FROM "file:///data_clean.csv" AS row
MERGE (b:buyer {buyer: coalesce(row.Buyer, "Unknown")})
MERGE (v:vendor {vendor: row.Vendor})
MERGE (p:property {property: coalesce(row.Asset, "Unknown")})
MERGE (v)-[r:SOLD]->(p)
MERGE (b)-[q:BOUGHT]->(p)
RETURN *;
ffmpeg -i video.avi -t 10 out%02d.gif
gifsicle --delay=10 --loop *.gif > anim.gifremove the last commit not pushed from the history while keeping local files intact
git reset --soft HEAD~1Remove the File from the Commit
git rm --cached data.csv
git commit --amend --no-edit
git push origin main
Inspired by the cheatsheet of my dear colleague Hay Kranen
