Skip to content

Instantly share code, notes, and snippets.

@DukeyToo
Created March 19, 2012 16:42
Show Gist options
  • Star 2 You must be signed in to star a gist
  • Fork 0 You must be signed in to fork a gist
  • Save DukeyToo/2118651 to your computer and use it in GitHub Desktop.
Save DukeyToo/2118651 to your computer and use it in GitHub Desktop.
Benchmarks exploring different patterns of Node.js worker processes on an HTTP server

This set of benchmarks explores the impact on a Node.js HTTP API server when some responses take more cpu than others. The requests are to a JSON page that calculates a random fibonacci sequence between 1 and 30. The server is using node-perfectapi with a feature that scales the http server across available cpus, while leaving the user's API code in the main Node.js process.

In the red series, the http server is running in the same process as the Fibonacci calculations. In the green series, the handling of all of the http web server stuff has been moved to separate node workers. In both cases, the Fibonacci calculations occur in a single thread in the main (master) Node process.

Benchmark showing response time hit

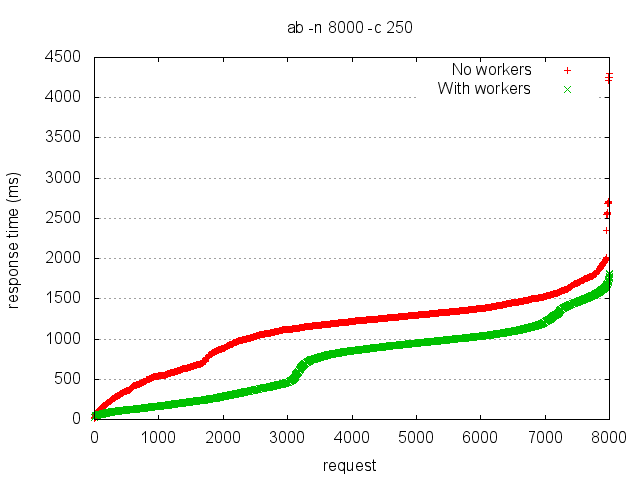
Now obviously the red series is going to be slower than the green series (because it is restricted to a single cpu for both http requests/responses and the calculation). What is interesting to me is the size of that difference. I don't think the size can be explained by just the lack of CPU power - it is also a lack of parallelism. The green series is able to parse and respond to requests independently of the Fibonacci calculation, and this results in improved response times.

Because of that, the red response times for all requests pay the cost of the slow ones (because the http server cannot process a new request until the calculation is complete on the last one). There are many ways to address this, and this set of benchmarks attempts to explore some of them.

Next, I added a single long-lived worker process just for the Fibonacci calculation. This should give the red series the parallelism it was missing before, and give both series an equivalent amount of CPU devoted to the calculation.

Different types of workers

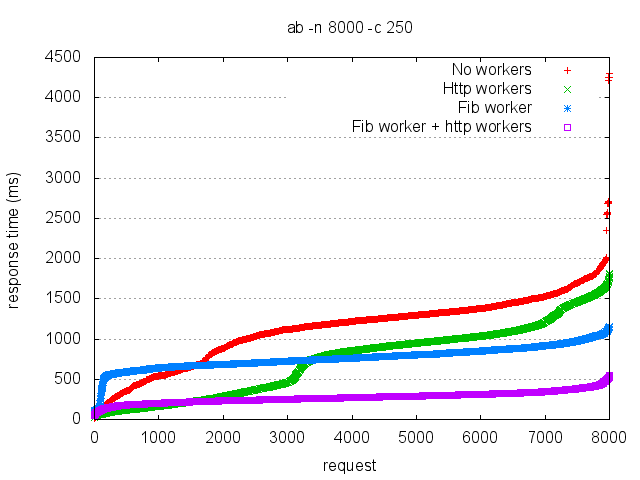
In addition to the original red and green, there are two new series in this chart. The blue series has the same code as the red, but I've given the Fibonacci calculation its own worker process. The blue line is almost flat, indicating a very consistent (but slow) response time. There are a couple of unexplained characteristics of the blue series - why does it spike so quickly in the beginning, and why is it so flat the rest of the time?

[Update: I think it spikes so quickly because the fib process quickly becomes saturated and cannot handle new requests. Once it spikes, the response time is flat because it is limited by the fib process].

The purple series adds an additional worker process for the Fibonacci calculations to the original green series. It also has an unexplained characteristic - why is it better over time than the green series? After all, the calculation was basically in its own process already (because the http was offloaded). I don't have a good answer.

Despite the unexplained pattern to the 2 new series, they do show the same relation to the original series, i.e. the one with the http workers still enjoys better response times.

Finally, for completeness I have one more set of benchmarks:

More fib workers

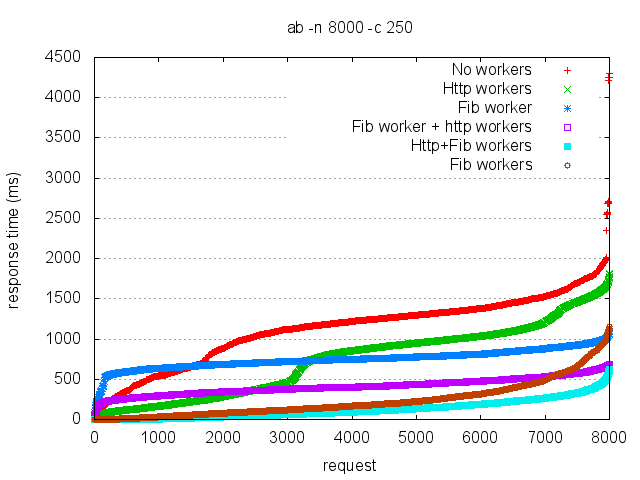
This set shows what happens when I fork 1 Fibonacci worker process for each CPU on my 8 core laptop. The brown line is 8 Fib workers with one main process handling everything else. The cyan line is 8 Fib workers + 8 http workers + a main process in the middle. Once again, the http workers have a positive impact on response time (50% within 92ms vs. 50% within 167ms).

BTW, all cores on my laptop are maxed out under both these last 2 series (none of the previous tests did that). Its kind-of fun to see that.

#!/usr/bin/env node
var perfectapi = require('../api.js');
var path = require('path');
var configPath = path.resolve(__dirname, 'fib.json');
var parser = new perfectapi.Parser();
var worker = require('child_process').fork(__dirname + '/fibworker.js');
var callbacks = {};
var requestNum = 0;
worker.on('message', function(m) {
var callback = callbacks[m.id];
delete callbacks[m.id];
callback(null, m.result);
})
var numWorkers = require('os').cpus().length;
var nextWorker = 0;
var workers = [];
for (var i=0;i<numWorkers;i++) {
var worker = require('child_process').fork(__dirname + '/fibworker.js');
workers.push(worker);
worker.on('message', function(m) {
var callback = callbacks[m.id];
delete callbacks[m.id];
callback(null, m.result);
})
}
//handle the commands
parser.on('fib', function(config, callback) {
var n = config.number;
if (n<1 || n>40) {
callback('n must be between 1 and 40');
} else {
callback(null, fibonacci(n))
}
})
parser.on('randomfib', function(config, callback) {
var n = Math.ceil(Math.random()*30)
callback(null, fibonacci(n));
})
parser.on('randomfib2', function(config, callback) {
requestNum += 1;
callbacks[requestNum] = callback;
var n = Math.ceil(Math.random()*30)
worker.send({n: n, id: requestNum});
})
parser.on('randomfib3', function(config, callback) {
requestNum += 1;
callbacks[requestNum] = callback;
var n = Math.ceil(Math.random()*30);
//round robin workers
var worker = workers[nextWorker];
nextWorker += 1;
if (nextWorker == workers.length) nextWorker = 0;
worker.send({n: n, id: requestNum});
})
//expose the api
module.exports = parser.parse(configPath);
function fibonacci(n) {
if (n < 2)
return 1;
else
return fibonacci(n-2) + fibonacci(n-1);
}
{ "exports": "fib",
"signature": [
{
"name": "fib",
"synopsis": "runs a fibonacci sequence",
"verb": "POST",
"parameters": [
{"name": "number", "required":true, "description":"which fibonacci to calculate"}
]
},
{
"name": "randomfib",
"synopsis": "runs a random fibonacci sequence, 1 to 30"
},
{
"name": "randomfib2",
"synopsis": "runs a random fibonacci sequence, 1 to 30, using a long-lived worker process"
},
{
"name": "randomfib3",
"synopsis": "runs a random fibonacci sequence, 1 to 30, using multiple long-lived worker processes"
}
],
"path": "fib"
}
This is ApacheBench, Version 2.3 <$Revision: 655654 $>
Copyright 1996 Adam Twiss, Zeus Technology Ltd, http://www.zeustech.net/
Licensed to The Apache Software Foundation, http://www.apache.org/
Benchmarking 127.0.0.1 (be patient)
Completed 800 requests
Completed 1600 requests
Completed 2400 requests
Completed 3200 requests
Completed 4000 requests
Completed 4800 requests
Completed 5600 requests
Completed 6400 requests
Completed 7200 requests
Completed 8000 requests
Finished 8000 requests
Server Software:
Server Hostname: 127.0.0.1
Server Port: 3002
Document Path: /fib/randomfib
Document Length: 3 bytes
Concurrency Level: 250
Time taken for tests: 36.856 seconds
Complete requests: 8000
Failed requests: 6667
(Connect: 0, Receive: 0, Length: 6667, Exceptions: 0)
Write errors: 0
Keep-Alive requests: 8000
Total transferred: 1164692 bytes
HTML transferred: 28692 bytes
Requests per second: 217.06 [#/sec] (mean)
Time per request: 1151.753 [ms] (mean)
Time per request: 4.607 [ms] (mean, across all concurrent requests)
Transfer rate: 30.86 [Kbytes/sec] received
Connection Times (ms)
min mean[+/-sd] median max
Connect: 0 0 5.6 0 499
Processing: 8 1128 442.5 1220 4299
Waiting: 8 1128 442.5 1220 4299
Total: 8 1129 442.7 1220 4299
Percentage of the requests served within a certain time (ms)
50% 1220
66% 1318
75% 1379
80% 1435
90% 1574
95% 1738
98% 1873
99% 1959
100% 4299 (longest request)
This is ApacheBench, Version 2.3 <$Revision: 655654 $>
Copyright 1996 Adam Twiss, Zeus Technology Ltd, http://www.zeustech.net/
Licensed to The Apache Software Foundation, http://www.apache.org/
Benchmarking 127.0.0.1 (be patient)
Completed 800 requests
Completed 1600 requests
Completed 2400 requests
Completed 3200 requests
Completed 4000 requests
Completed 4800 requests
Completed 5600 requests
Completed 6400 requests
Completed 7200 requests
Completed 8000 requests
Finished 8000 requests
Server Software:
Server Hostname: 127.0.0.1
Server Port: 3002
Document Path: /fib/randomfib2
Document Length: 4 bytes
Concurrency Level: 250
Time taken for tests: 24.310 seconds
Complete requests: 8000
Failed requests: 6923
(Connect: 0, Receive: 0, Length: 6923, Exceptions: 0)
Write errors: 0
Keep-Alive requests: 8000
Total transferred: 1164615 bytes
HTML transferred: 28615 bytes
Requests per second: 329.08 [#/sec] (mean)
Time per request: 759.700 [ms] (mean)
Time per request: 3.039 [ms] (mean, across all concurrent requests)
Transfer rate: 46.78 [Kbytes/sec] received
Connection Times (ms)
min mean[+/-sd] median max
Connect: 0 0 0.1 0 1
Processing: 58 748 119.0 748 1070
Waiting: 58 748 119.0 748 1070
Total: 58 748 119.0 748 1070
Percentage of the requests served within a certain time (ms)
50% 748
66% 786
75% 811
80% 840
90% 898
95% 937
98% 976
99% 995
100% 1070 (longest request)
This is ApacheBench, Version 2.3 <$Revision: 655654 $>
Copyright 1996 Adam Twiss, Zeus Technology Ltd, http://www.zeustech.net/
Licensed to The Apache Software Foundation, http://www.apache.org/
Benchmarking 127.0.0.1 (be patient)
Completed 800 requests
Completed 1600 requests
Completed 2400 requests
Completed 3200 requests
Completed 4000 requests
Completed 4800 requests
Completed 5600 requests
Completed 6400 requests
Completed 7200 requests
Completed 8000 requests
Finished 8000 requests
Server Software:
Server Hostname: 127.0.0.1
Server Port: 3002
Document Path: /fib/randomfib2
Document Length: 6 bytes
Concurrency Level: 250
Time taken for tests: 25.967 seconds
Complete requests: 8000
Failed requests: 6668
(Connect: 0, Receive: 0, Length: 6668, Exceptions: 0)
Write errors: 0
Keep-Alive requests: 8000
Total transferred: 1165235 bytes
HTML transferred: 29093 bytes
Requests per second: 308.08 [#/sec] (mean)
Time per request: 811.484 [ms] (mean)
Time per request: 3.246 [ms] (mean, across all concurrent requests)
Transfer rate: 43.82 [Kbytes/sec] received
Connection Times (ms)
min mean[+/-sd] median max
Connect: 0 0 0.1 0 1
Processing: 44 409 101.6 402 686
Waiting: 44 409 101.6 402 686
Total: 44 409 101.6 402 686
Percentage of the requests served within a certain time (ms)
50% 402
66% 445
75% 476
80% 495
90% 546
95% 586
98% 628
99% 647
100% 686 (longest request)
This is ApacheBench, Version 2.3 <$Revision: 655654 $>
Copyright 1996 Adam Twiss, Zeus Technology Ltd, http://www.zeustech.net/
Licensed to The Apache Software Foundation, http://www.apache.org/
Benchmarking 127.0.0.1 (be patient)
Completed 800 requests
Completed 1600 requests
Completed 2400 requests
Completed 3200 requests
Completed 4000 requests
Completed 4800 requests
Completed 5600 requests
Completed 6400 requests
Completed 7200 requests
Completed 8000 requests
Finished 8000 requests
Server Software:
Server Hostname: 127.0.0.1
Server Port: 3002
Document Path: /fib/randomfib
Document Length: 2 bytes
Concurrency Level: 250
Time taken for tests: 25.150 seconds
Complete requests: 8000
Failed requests: 6684
(Connect: 0, Receive: 0, Length: 6684, Exceptions: 0)
Write errors: 0
Keep-Alive requests: 8000
Total transferred: 1164838 bytes
HTML transferred: 28554 bytes
Requests per second: 318.09 [#/sec] (mean)
Time per request: 785.951 [ms] (mean)
Time per request: 3.144 [ms] (mean, across all concurrent requests)
Transfer rate: 45.23 [Kbytes/sec] received
Connection Times (ms)
min mean[+/-sd] median max
Connect: 0 0 0.1 0 1
Processing: 14 585 538.7 322 2226
Waiting: 14 585 538.7 322 2226
Total: 15 585 538.7 322 2226
Percentage of the requests served within a certain time (ms)
50% 322
66% 455
75% 609
80% 1297
90% 1549
95% 1679
98% 1812
99% 1905
100% 2226 (longest request)
This is ApacheBench, Version 2.3 <$Revision: 655654 $>
Copyright 1996 Adam Twiss, Zeus Technology Ltd, http://www.zeustech.net/
Licensed to The Apache Software Foundation, http://www.apache.org/
Benchmarking 127.0.0.1 (be patient)
Completed 800 requests
Completed 1600 requests
Completed 2400 requests
Completed 3200 requests
Completed 4000 requests
Completed 4800 requests
Completed 5600 requests
Completed 6400 requests
Completed 7200 requests
Completed 8000 requests
Finished 8000 requests
Server Software:
Server Hostname: 127.0.0.1
Server Port: 3002
Document Path: /fib/randomfib3
Document Length: 2 bytes
Concurrency Level: 250
Time taken for tests: 8.162 seconds
Complete requests: 8000
Failed requests: 6632
(Connect: 0, Receive: 0, Length: 6632, Exceptions: 0)
Write errors: 0
Keep-Alive requests: 8000
Total transferred: 1164800 bytes
HTML transferred: 28658 bytes
Requests per second: 980.10 [#/sec] (mean)
Time per request: 255.077 [ms] (mean)
Time per request: 1.020 [ms] (mean, across all concurrent requests)
Transfer rate: 139.36 [Kbytes/sec] received
Connection Times (ms)
min mean[+/-sd] median max
Connect: 0 0 0.1 0 12
Processing: 0 124 114.2 92 621
Waiting: 0 124 114.2 92 621
Total: 0 124 114.2 92 621
Percentage of the requests served within a certain time (ms)
50% 92
66% 148
75% 189
80% 217
90% 288
95% 349
98% 427
99% 478
100% 621 (longest request)
This is ApacheBench, Version 2.3 <$Revision: 655654 $>
Copyright 1996 Adam Twiss, Zeus Technology Ltd, http://www.zeustech.net/
Licensed to The Apache Software Foundation, http://www.apache.org/
Benchmarking 127.0.0.1 (be patient)
Completed 800 requests
Completed 1600 requests
Completed 2400 requests
Completed 3200 requests
Completed 4000 requests
Completed 4800 requests
Completed 5600 requests
Completed 6400 requests
Completed 7200 requests
Completed 8000 requests
Finished 8000 requests
Server Software:
Server Hostname: 127.0.0.1
Server Port: 3002
Document Path: /fib/randomfib3
Document Length: 2 bytes
Concurrency Level: 250
Time taken for tests: 7.852 seconds
Complete requests: 8000
Failed requests: 6645
(Connect: 0, Receive: 0, Length: 6645, Exceptions: 0)
Write errors: 0
Keep-Alive requests: 8000
Total transferred: 1164678 bytes
HTML transferred: 28678 bytes
Requests per second: 1018.79 [#/sec] (mean)
Time per request: 245.389 [ms] (mean)
Time per request: 0.982 [ms] (mean, across all concurrent requests)
Transfer rate: 144.84 [Kbytes/sec] received
Connection Times (ms)
min mean[+/-sd] median max
Connect: 0 0 0.4 0 25
Processing: 0 234 221.4 167 1150
Waiting: 0 234 221.5 167 1150
Total: 0 234 221.4 167 1150
Percentage of the requests served within a certain time (ms)
50% 167
66% 245
75% 315
80% 373
90% 566
95% 727
98% 901
99% 961
100% 1150 (longest request)
Sign up for free to join this conversation on GitHub. Already have an account? Sign in to comment