-
-
Save Hermann-SW/ec9bfcb59a2ad0b64336519c48286ad6 to your computer and use it in GitHub Desktop.
| #!/usr/bin/env python | |
| """ view graphviz file """ | |
| # pylint: disable=C0103 | |
| import sys | |
| import webbrowser | |
| import urllib.parse | |
| import time | |
| if len(sys.argv)<3: | |
| print("Format: "+sys.argv[0]+" browser dotfile") | |
| else: | |
| B=webbrowser.get(sys.argv[1]) | |
| with open(sys.argv[2], encoding="utf-8") as f: | |
| s=urllib.parse.quote("".join(line for line in f)) | |
| T=str(int(time.time())) | |
| B.open("https://stamm-wilbrandt.de/GraphvizFiddle/2.1.2/?"+T+"#"+s) |
After installing boost …
sudo apt install libboost-all-dev
sudo apt install libboost-doc
… there are some .dot examples:
pi@raspberrypi5:~ $ cp -r /usr/share/doc/libboost1.74-doc/examples/libs/graph/example .
pi@raspberrypi5:~ $ cd example/
pi@raspberrypi5:~/example $ ls figs/
cc-internet.dot edge-connectivity.dot scc.dot
dfs-example.dot ospf-graph.dot telephone-network.dot
pi@raspberrypi5:~/example $
New .dot files will be created by boost graph library examples as well:
pi@raspberrypi5:~/example $ g++ bellman-example.cpp -o bellman-example
pi@raspberrypi5:~/example $ ./bellman-example
u: 2 v
v: 4 x
x: 7 z
y: -2 u
z: 0 z
pi@raspberrypi5:~/example $ ls figs/bellman-eg.dot
figs/bellman-eg.dot
pi@raspberrypi5:~/example $ GraphvizFiddle.py firefox figs/bellman-eg.dot
pi@raspberrypi5:~/example $
Revision 2 changes GraphvizFiddle URL to version 2.1.2, allowing to specify layout engine.
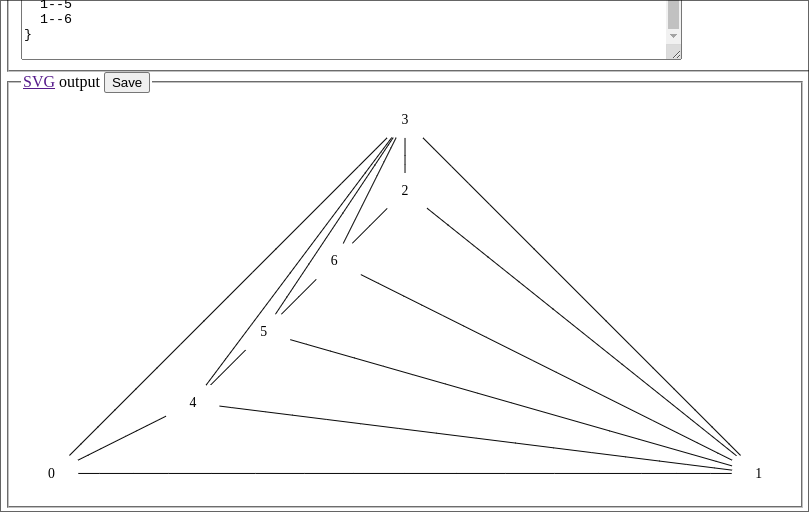
This BGL (Boost Graph Library) demo computes coordinates for a straight line drawing:
pi@raspberrypi5:~/example $ g++ straight_line_drawing.cpp -o straight_line_drawing
pi@raspberrypi5:~/example $ ./straight_line_drawing
The straight line drawing is:
0 -> (0, 0)
1 -> (10, 0)
2 -> (5, 4)
3 -> (5, 5)
4 -> (2, 1)
5 -> (3, 2)
6 -> (4, 3)
Is a plane drawing.
pi@raspberrypi5:~/example $
These are the edges of the graph:
pi@raspberrypi5:~/example $ grep add_edge straight_line_drawing.cpp
add_edge(0, 1, g);
add_edge(1, 2, g);
add_edge(2, 3, g);
add_edge(3, 0, g);
add_edge(3, 4, g);
add_edge(4, 5, g);
add_edge(5, 6, g);
add_edge(6, 3, g);
add_edge(0, 4, g);
add_edge(1, 3, g);
add_edge(3, 5, g);
add_edge(2, 6, g);
add_edge(1, 4, g);
add_edge(1, 5, g);
add_edge(1, 6, g);
pi@raspberrypi5:~/example $
Currently handcompiled into neato layout engine graph (because neato allows to fixate positions, those from demo output):
pi@raspberrypi5:~/example $ cat figs/straight_line_drawing.dot
graph {
layout=neato;
node [shape=none]
0 [pos="0,0!"]
1 [pos="10,0!"]
2 [pos="5,4!"]
3 [pos="5,5!"]
4 [pos="2,1!"]
5 [pos="3,2!"]
6 [pos="4,3!"]
0--1
1--2
2--3
3--0
3--4
4--5
5--6
6--3
0--4
1--3
3--5
2--6
1--4
1--5
1--6
}
pi@raspberrypi5:~/example $
Opening in browser:
pi@raspberrypi5:~/example $ GraphvizFiddle.py chromium-browser figs/straight_line_drawing.dot
Opening in existing browser session.
pi@raspberrypi5:~/example $
New gist "straight_line_graphviz.cpp" generates the complete graphviz graph as output:
https://gist.github.com/Hermann-SW/99d151a273d290ee0d843c79b2da26a8?permalink_comment_id=4985753#gistcomment-4985753
pi@raspberrypi5:~ $ ./straight_line_graphviz | head -5
graph {
layout=neato
node [shape=none]
0 [pos="0,0!"]
1 [pos="16,0!"]
pi@raspberrypi5:~ $ ./straight_line_graphviz | tail -3
8--5
9--6
}
pi@raspberrypi5:~ $
So now GraphvizFiddle.py is of real help and opens result directly in browser:
pi@raspberrypi5:~ $ GraphvizFiddle.py firefox <(./straight_line_graphviz)
pi@raspberrypi5:~ $
Revision 3 does use webbrowser module instead of os.system():
pi@raspberrypi5:~ $ pylint /usr/local/bin/GraphvizFiddle.py

--------------------------------------------------------------------
Your code has been rated at 10.00/10 (previous run: 10.00/10, +0.00)

pi@raspberrypi5:~ $
Opens specified graphviz .dot file in GraphvizFiddle of specified browser: