Last active
March 15, 2024 01:40
-
-
Save Hermann-SW/ec9bfcb59a2ad0b64336519c48286ad6 to your computer and use it in GitHub Desktop.
Open graphviz .dot file in GraphvizFiddle in browser
This file contains bidirectional Unicode text that may be interpreted or compiled differently than what appears below. To review, open the file in an editor that reveals hidden Unicode characters.
Learn more about bidirectional Unicode characters
| #!/usr/bin/env python | |
| """ view graphviz file """ | |
| # pylint: disable=C0103 | |
| import sys | |
| import webbrowser | |
| import urllib.parse | |
| import time | |
| if len(sys.argv)<3: | |
| print("Format: "+sys.argv[0]+" browser dotfile") | |
| else: | |
| B=webbrowser.get(sys.argv[1]) | |
| with open(sys.argv[2], encoding="utf-8") as f: | |
| s=urllib.parse.quote("".join(line for line in f)) | |
| T=str(int(time.time())) | |
| B.open("https://stamm-wilbrandt.de/GraphvizFiddle/2.1.2/?"+T+"#"+s) |
Revision 2 changes GraphvizFiddle URL to version 2.1.2, allowing to specify layout engine.
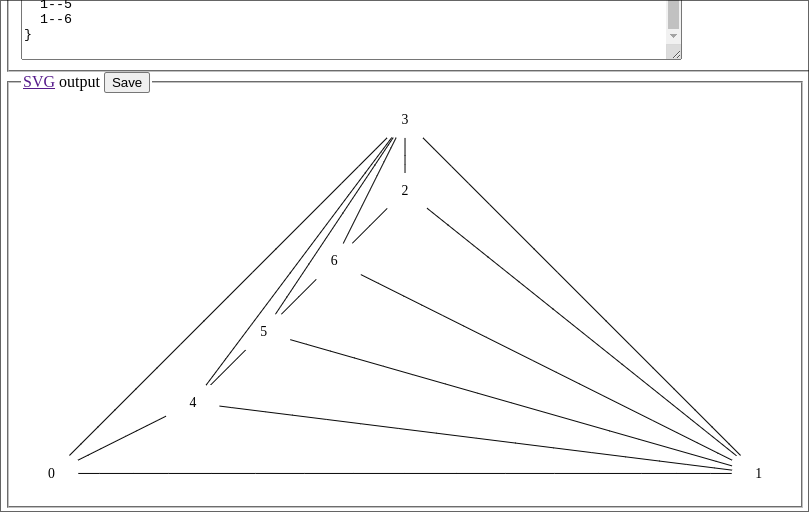
This BGL (Boost Graph Library) demo computes coordinates for a straight line drawing:
pi@raspberrypi5:~/example $ g++ straight_line_drawing.cpp -o straight_line_drawing
pi@raspberrypi5:~/example $ ./straight_line_drawing
The straight line drawing is:
0 -> (0, 0)
1 -> (10, 0)
2 -> (5, 4)
3 -> (5, 5)
4 -> (2, 1)
5 -> (3, 2)
6 -> (4, 3)
Is a plane drawing.
pi@raspberrypi5:~/example $
These are the edges of the graph:
pi@raspberrypi5:~/example $ grep add_edge straight_line_drawing.cpp
    add_edge(0, 1, g);
    add_edge(1, 2, g);
    add_edge(2, 3, g);
    add_edge(3, 0, g);
    add_edge(3, 4, g);
    add_edge(4, 5, g);
    add_edge(5, 6, g);
    add_edge(6, 3, g);
    add_edge(0, 4, g);
    add_edge(1, 3, g);
    add_edge(3, 5, g);
    add_edge(2, 6, g);
    add_edge(1, 4, g);
    add_edge(1, 5, g);
    add_edge(1, 6, g);
pi@raspberrypi5:~/example $
Currently handcompiled into neato layout engine graph (because neato allows to fixate positions, those from demo output):
pi@raspberrypi5:~/example $ cat figs/straight_line_drawing.dot
graph {
  layout=neato;
  node [shape=none]
  0 [pos="0,0!"]
  1 [pos="10,0!"]
  2 [pos="5,4!"]
  3 [pos="5,5!"]
  4 [pos="2,1!"]
  5 [pos="3,2!"]
  6 [pos="4,3!"]
  0--1
  1--2
  2--3
  3--0
  3--4
  4--5
  5--6
  6--3
  0--4
  1--3
  3--5
  2--6
  1--4
  1--5
  1--6
}
pi@raspberrypi5:~/example $
Opening in browser:
pi@raspberrypi5:~/example $ GraphvizFiddle.py chromium-browser figs/straight_line_drawing.dot
Opening in existing browser session.
pi@raspberrypi5:~/example $
New gist "straight_line_graphviz.cpp" generates the complete graphviz graph as output:
https://gist.github.com/Hermann-SW/99d151a273d290ee0d843c79b2da26a8?permalink_comment_id=4985753#gistcomment-4985753
pi@raspberrypi5:~ $ ./straight_line_graphviz | head -5
graph {
  layout=neato
  node [shape=none]
  0 [pos="0,0!"]
  1 [pos="16,0!"]
pi@raspberrypi5:~ $ ./straight_line_graphviz | tail -3
  8--5
  9--6
}
pi@raspberrypi5:~ $
So now GraphvizFiddle.py is of real help and opens result directly in browser:
pi@raspberrypi5:~ $ GraphvizFiddle.py firefox <(./straight_line_graphviz)
pi@raspberrypi5:~ $
Revision 3 does use webbrowser module instead of os.system():
pi@raspberrypi5:~ $ pylint /usr/local/bin/GraphvizFiddle.py

--------------------------------------------------------------------
Your code has been rated at 10.00/10 (previous run: 10.00/10, +0.00)

pi@raspberrypi5:~ $
Sign up for free
to join this conversation on GitHub.
Already have an account?
Sign in to comment
After installing boost …
… there are some .dot examples:
New .dot files will be created by boost graph library examples as well: