Skip to content

Instantly share code, notes, and snippets.

@Paraphraser
Created August 22, 2021 14:05
Show Gist options
  • Save Paraphraser/bd4eb1ebd0a7d94bd50111efba7bfbe2 to your computer and use it in GitHub Desktop.
Save Paraphraser/bd4eb1ebd0a7d94bd50111efba7bfbe2 to your computer and use it in GitHub Desktop.
IOTstack Tutorial: Logging CPU Temperatures

IOTstack Tutorial: Logging CPU Temperatures

introduction

This gist answers a Discord question. It explains my approach to collecting CPU temperatures by sending the data as an MQTT payload.

I like to think of this approach as working with the MING (Mosquitto, InfluxDB, Node-RED, Grafana) paradigm rather than fighting against it (eg using approaches like SSH calling out of the Node-RED container).

The approach is not tied to the Raspberry Pi that is running IOTstack. If you have several Raspberry Pis, they can all log their temperatures to the Raspberry Pi running IOTstack using exactly the same mechanism.

The concept can also be extended to other types of computer. I'm using it to collect CPU temperatures for macOS systems too.

if you are a Windows user…

Be very careful about copying and pasting text from this gist. Unless you take precautions, Windows will add its CR+LF line-endings and those will cause problems.

collection script

  • Assumed path name: ~/.local/bin/publish_rpi_temperature

  • Script content:

     #!/usr/bin/env bash
     
     mkdir -p ~/Logs
     
     mosquitto_pub -h mosquitto.mydomain.com -t "/mytopic/computer/pi" -m "{\
     \"host\": \"$HOSTNAME\", \
     \"temp\": $(vcgencmd measure_temp | cut -c 6-9)\
     }"

    The script assumes the Mosquitto clients are installed:

     $ sudo apt install mosquitto-clients

    You will need to customise:

    • The target host "mosquitto.mydomain.com" using the fully-qualified domain name, or host name, or multicast DNS name, or IP address of the Raspberry Pi running IOTstack.
    • The topic "/mytopic/computer/pi". Although I did not need to use it, I originally added the "/pi" suffix to the topic string in case I needed to know the type of computer that had generated the payload. My Raspberry Pi's use "/pi"; my macOS machines "/mac".

    This script is specific to the Raspberry Pi. To port the script to a different type of host you will need to:

    • find an alternative for vcgencmd; and
    • make sure that the HOSTNAME environment variable contains a sensible value (eg on macOS, it contains the fully-qualified domain name rather than the host name).

The MQTT messages sent by this script look like this:

/mytopic/computer/mac {"host": "bauxite", "temp": 46.5}
/mytopic/computer/mac {"host": "magnetite", "temp": 28.8}
/mytopic/computer/mac {"host": "gravel", "temp": 35.2}
/mytopic/computer/mac {"host": "marble", "temp": 34.2}
/mytopic/computer/pi {"host": "octopi", "temp": 41.3}
/mytopic/computer/pi {"host": "new-dev", "temp": 43.3}
/mytopic/computer/pi {"host": "iot-hub", "temp": 46.2}
/mytopic/computer/pi {"host": "sec-dev", "temp": 45.2}

scaffolding

$ mkdir -p ~/Logs

The collection script does not normally produce output unless there is an error condition. If the script does not appear to be working, the place to start looking is:

$ tail ~/Logs/publish_rpi_temperature.log

cron job

  • Preamble (should be common to all crontab files):

     SHELL=/bin/bash
     HOME=/home/pi
     PATH=/home/pi/.local/bin:/usr/local/sbin:/usr/local/bin:/usr/sbin:/usr/bin:/sbin:/bin
  • Event trigger:

     # report system temperature every 5 minutes 
     */5	*	*	*	*	publish_rpi_temperature >>./Logs/publish_rpi_temperature.log 2>&1

influx database

The InfluxDB database needs to be initialised before you can write to it. In this example, the database name is "computer".

$ docker exec -it influxdb influx
> create database computer
> exit
$

Within the "computer" database, each host computer logging temperatures generates its own series:

temperature,system=«hostname»

where "«hostname»" corresponds with the "host" key in the MQTT payload.

three-node flow

three-node flow

A Node-RED three-node flow handles the messages:

  • an MQTT-in node subscribing to the appropriate topic. In this example the topic is "/mytopic/computer/+" where "+" is a single-level wildcard.

  • a Change node to prepare the payload for insertion into InfluxDB:

     [
         {
             "temp": payload.temp
         },{
             "system": payload.host
         }
     ]

    In words:

    • temperature is added as a field (data);
    • the name of the host reporting the temperature is added as a tag (metadata)
  • an InfluxDB-out node inserts the prepared payload into the database named "computer".

Given the incoming MQTT message:

/mytopic/computer/pi {"host": "iot-hub", "temp": 46.2}

The overall effect of the flow is:

> USE computer
> INSERT temperature,system='iot-hub' temp=46.2
> exit

You should be able to copy the JSON content below and use the "Import" command in the main menu (three horizontal bars "≡" at the top, right of the Node-Red window) to create a new flow containing the three nodes.

Depending on how your system is set up, the flow may need some tinkering before it works.

[
    {
        "id": "cc5ffba5.fdc7c8",
        "type": "tab",
        "label": "CPU Temperatures",
        "disabled": false,
        "info": ""
    },
    {
        "id": "796d8452.225294",
        "type": "change",
        "z": "cc5ffba5.fdc7c8",
        "name": "prepare fields",
        "rules": [
            {
                "t": "set",
                "p": "payload",
                "pt": "msg",
                "to": "[\t    {\t        \"temp\": payload.temp\t    },{\t        \"system\": payload.host\t    }\t]\t",
                "tot": "jsonata"
            }
        ],
        "action": "",
        "property": "",
        "from": "",
        "to": "",
        "reg": false,
        "x": 340,
        "y": 100,
        "wires": [
            [
                "d27128f3.4050c8"
            ]
        ]
    },
    {
        "id": "d27128f3.4050c8",
        "type": "influxdb out",
        "z": "cc5ffba5.fdc7c8",
        "influxdb": "626e8bc5.4c702c",
        "name": "write to InfluxDB",
        "measurement": "temperature",
        "precision": "",
        "retentionPolicy": "",
        "database": "",
        "retentionPolicyV18Flux": "",
        "org": "",
        "bucket": "",
        "x": 570,
        "y": 100,
        "wires": []
    },
    {
        "id": "39543010.e0258",
        "type": "mqtt in",
        "z": "cc5ffba5.fdc7c8",
        "name": "/mytopic/computer/+",
        "topic": "/mytopic/computer/+",
        "qos": "2",
        "datatype": "json",
        "broker": "c5d29fb5.89907",
        "x": 130,
        "y": 100,
        "wires": [
            [
                "796d8452.225294"
            ]
        ]
    },
    {
        "id": "626e8bc5.4c702c",
        "type": "influxdb",
        "hostname": "influxdb",
        "port": "8086",
        "protocol": "http",
        "database": "computer",
        "name": "",
        "usetls": false,
        "tls": "",
        "influxdbVersion": "1.x"
    },
    {
        "id": "c5d29fb5.89907",
        "type": "mqtt-broker",
        "name": "Docker MQTT",
        "broker": "mosquitto",
        "port": "1883",
        "clientid": "",
        "usetls": false,
        "compatmode": false,
        "protocolVersion": 4,
        "keepalive": "60",
        "cleansession": true,
        "birthTopic": "",
        "birthQos": "0",
        "birthRetain": "false",
        "birthPayload": "",
        "closeTopic": "",
        "closeQos": "0",
        "closeRetain": "false",
        "closePayload": "",
        "willTopic": "",
        "willQos": "0",
        "willRetain": "false",
        "willPayload": ""
    }
]

example data

$ docker exec -it influxdb influx -precision=rfc3339
Connected to http://localhost:8086 version 1.8.9
InfluxDB shell version: 1.8.9

> use computer
Using database computer

> show series
key
---
temperature,system=bauxite
temperature,system=gravel
temperature,system=iot-hub
temperature,system=magnetite
temperature,system=marble
temperature,system=new-dev
temperature,system=octopi
temperature,system=sec-dev
temperature,system=sjgair

> select * from temperature where time > now() - 10m tz('Australia/Sydney')
name: temperature
time                                system    temp
----                                ------    ----
2021-08-22T23:40:00.271972208+10:00 marble    35.2
2021-08-22T23:40:00.674021388+10:00 magnetite 29.6
2021-08-22T23:40:00.937395236+10:00 gravel    36.6
2021-08-22T23:40:01.065496792+10:00 bauxite   46
2021-08-22T23:40:01.220100822+10:00 sec-dev   46.7
2021-08-22T23:40:01.87568606+10:00  iot-hub   47.7
2021-08-22T23:40:01.892511832+10:00 octopi    40.8
2021-08-22T23:40:02.021640681+10:00 new-dev   42.8
2021-08-22T23:45:00.210631999+10:00 magnetite 28.9
2021-08-22T23:45:00.453033759+10:00 gravel    35.6
2021-08-22T23:45:00.545580449+10:00 bauxite   46.4
2021-08-22T23:45:00.840558319+10:00 marble    35.6
2021-08-22T23:45:01.133290607+10:00 new-dev   43.3
2021-08-22T23:45:01.319572925+10:00 sec-dev   46.2
2021-08-22T23:45:01.977801647+10:00 iot-hub   46.7
2021-08-22T23:45:01.99638355+10:00  octopi    41.3

> exit
$

grafana visualisation

Shows a mixture of Raspberry Pi and macOS CPU temperatures.

CPU temperature chart

@Paraphraser
Copy link
Author

Have a look at the following. I had to make a few assumptions so please keep these notes in mind.

  1. Because of the incomplete
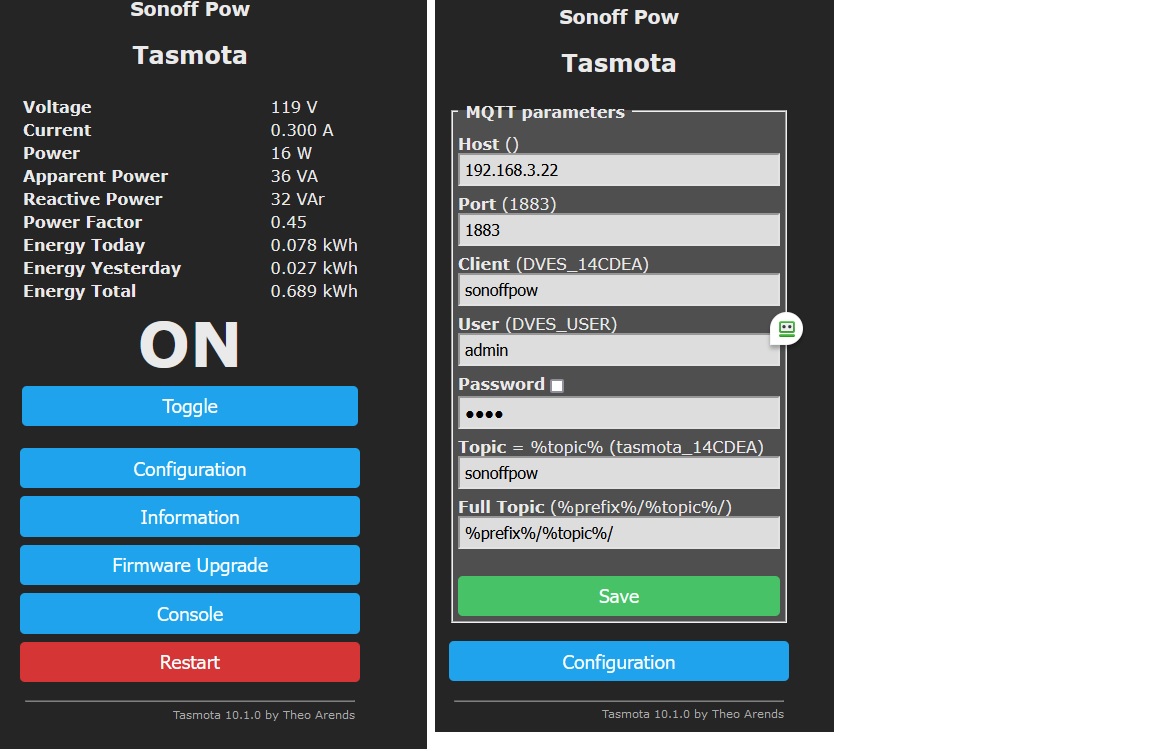
 docker ps I could not tell whether Node-RED is running in host mode or non-host mode. I'm running in non-host mode so I changed the 127.0.0.1:1883 to mosquitto:1883, and the 127.0.0.1:8086 to influxdb:8086. If your Node-RED is running in host mode, you will have to change those back.

  2. I'm assuming this is a Sonoff Power Switch. I further assume it's possible you'll have more than one of those. I further assume that, given the topic pattern tele/sonoffpow/SENSOR, one of those fields is meant to indicate which Sonoff Power Switch is sending the telemetry. For the purposes of this example, I assumed "sonoffpow" but if "tele" means something like "television" and that's meant to be the discriminator between different Sonoff Power Switches, can I suggest that you consider changing the ordering so it's sonoffpow/tele/SENSOR and sonoffpow/tele/STATE.

  3. You need to split SENSOR and STATE somehow and the easiest way to do what is two separate subscribers - you'll see that I've done that. If you don't do it at the subscriber, you need another node to vector on the message type so you don't lose/gain anything either way.

  4. Also, a good "trick" is to change MQTT-in nodes so they deliver parsed JSON output. That way you don't need a separate JSON node.

  5. Another good trick is to see what Node-RED does if you leave "Name" fields empty. Often, Node-RED gives you a good summary of what's going on. You'll see that in the MQTT-in nodes. It's Node-RED that's providing the topic string on the canvas and that's exactly what you usually want.

  6. You need to be very careful with spaces. I found a bug in your InfluxDB-out node caused by a trailing space. Once I deleted it, the insert worked.

  7. You'll see I lean towards camel-case field and tag names in Influx. Obviously that's up to you. If you want to capitalise everything, go for it.

  8. Whenever you start working with Influx, you need to create the database by hand. That's true with Influx 1.8 but I don't know if it's different for Influx 2.x:

    $ docker exec -it influxdb influx -precision=rfc3339
    > create database sonofpow
    > exit
    $
    

The flow:

[
    {
        "id": "0abb9dc2d326cf1b",
        "type": "tab",
        "label": "Flow 5",
        "disabled": false,
        "info": "",
        "env": []
    },
    {
        "id": "4f68e1c7.43cce",
        "type": "mqtt in",
        "z": "0abb9dc2d326cf1b",
        "name": "",
        "topic": "tele/+/SENSOR",
        "qos": "0",
        "datatype": "json",
        "broker": "e40a6e76.c9f3d",
        "nl": false,
        "rap": false,
        "rh": "0",
        "inputs": 0,
        "x": 120,
        "y": 380,
        "wires": [
            [
                "fdc5662e2657f640",
                "2886fa70283df190",
                "af9e30fb.3217b"
            ]
        ]
    },
    {
        "id": "27b3a4db.fab30c",
        "type": "debug",
        "z": "0abb9dc2d326cf1b",
        "name": "",
        "active": false,
        "tosidebar": true,
        "console": false,
        "tostatus": false,
        "complete": "true",
        "targetType": "full",
        "statusVal": "",
        "statusType": "auto",
        "x": 510,
        "y": 460,
        "wires": []
    },
    {
        "id": "af9e30fb.3217b",
        "type": "function",
        "z": "0abb9dc2d326cf1b",
        "name": "",
        "func": "\nvar msg1 = {};\nvar msg2 = {};\nvar msg3 = {};\nvar msg4 = {};\nvar msg5 = {};\nvar msg6 = {};\nmsg1.payload = msg.payload.ENERGY.Voltage;\nmsg1.topic = \"Voltage\";\nmsg2.payload = msg.payload.ENERGY.Current;\nmsg2.topic = \"Current\";\nmsg3.payload = msg.payload.ENERGY.Factor;\nmsg3.topic = \"Power Factor\";\nmsg4.payload = msg.payload.ENERGY.Power;\nmsg4.topic = \"Power\";\nmsg5.payload = msg.payload.ENERGY.ApparentPower;\nmsg5.topic = \"Apparent Power\";\nmsg6.payload = msg.payload.ENERGY.ReactivePower ;\nmsg6.topic = \"Reactive Power\";\n\nreturn [[msg1,msg2,msg3,msg4,msg5,msg6]];",
        "outputs": 6,
        "noerr": 0,
        "initialize": "",
        "finalize": "",
        "libs": [],
        "x": 420,
        "y": 240,
        "wires": [
            [
                "783944b.71e4abc",
                "d11de45c580d7093"
            ],
            [
                "f5fdef7.f91a11"
            ],
            [
                "ca7d21bb4b2f3815"
            ],
            [
                "95dcfceed20e7d08"
            ],
            [
                "945812e5afd9f9aa"
            ],
            [
                "691a5578db6c7ea9"
            ]
        ]
    },
    {
        "id": "783944b.71e4abc",
        "type": "ui_chart",
        "z": "0abb9dc2d326cf1b",
        "name": "Voltage",
        "group": "8f214c59.22bec",
        "order": 1,
        "width": 0,
        "height": 0,
        "label": "Voltage",
        "chartType": "line",
        "legend": "false",
        "xformat": "HH:mm",
        "interpolate": "linear",
        "nodata": "",
        "dot": false,
        "ymin": "",
        "ymax": "",
        "removeOlder": 1,
        "removeOlderPoints": "",
        "removeOlderUnit": "604800",
        "cutout": 0,
        "useOneColor": false,
        "useUTC": false,
        "colors": [
            "#1f77b4",
            "#aec7e8",
            "#ff7f0e",
            "#2ca02c",
            "#98df8a",
            "#eb2d2f",
            "#ff9896",
            "#9467bd",
            "#c5b0d5"
        ],
        "outputs": 1,
        "useDifferentColor": false,
        "className": "",
        "x": 980,
        "y": 60,
        "wires": [
            []
        ]
    },
    {
        "id": "f5fdef7.f91a11",
        "type": "ui_chart",
        "z": "0abb9dc2d326cf1b",
        "name": "Current",
        "group": "8f214c59.22bec",
        "order": 3,
        "width": 0,
        "height": 0,
        "label": "Current",
        "chartType": "line",
        "legend": "false",
        "xformat": "HH:mm",
        "interpolate": "linear",
        "nodata": "",
        "dot": false,
        "ymin": "",
        "ymax": "",
        "removeOlder": 1,
        "removeOlderPoints": "",
        "removeOlderUnit": "604800",
        "cutout": 0,
        "useOneColor": false,
        "useUTC": false,
        "colors": [
            "#1f77b4",
            "#aec7e8",
            "#ff7f0e",
            "#2ca02c",
            "#51df44",
            "#d62728",
            "#ff9896",
            "#9467bd",
            "#c5b0d5"
        ],
        "outputs": 1,
        "useDifferentColor": false,
        "className": "",
        "x": 980,
        "y": 100,
        "wires": [
            []
        ]
    },
    {
        "id": "d11de45c580d7093",
        "type": "debug",
        "z": "0abb9dc2d326cf1b",
        "name": "",
        "active": false,
        "tosidebar": true,
        "console": false,
        "tostatus": false,
        "complete": "true",
        "targetType": "full",
        "statusVal": "",
        "statusType": "auto",
        "x": 610,
        "y": 60,
        "wires": []
    },
    {
        "id": "ca7d21bb4b2f3815",
        "type": "ui_chart",
        "z": "0abb9dc2d326cf1b",
        "name": "Power Factor",
        "group": "8f214c59.22bec",
        "order": 4,
        "width": 0,
        "height": 0,
        "label": "Power Factor",
        "chartType": "line",
        "legend": "false",
        "xformat": "HH:mm",
        "interpolate": "linear",
        "nodata": "",
        "dot": false,
        "ymin": "",
        "ymax": "",
        "removeOlder": 1,
        "removeOlderPoints": "",
        "removeOlderUnit": "604800",
        "cutout": 0,
        "useOneColor": false,
        "useUTC": false,
        "colors": [
            "#1f77b4",
            "#aec7e8",
            "#ff7f0e",
            "#2ca02c",
            "#51df44",
            "#d62728",
            "#ff9896",
            "#9467bd",
            "#c5b0d5"
        ],
        "outputs": 1,
        "useDifferentColor": false,
        "className": "",
        "x": 1000,
        "y": 140,
        "wires": [
            []
        ]
    },
    {
        "id": "691a5578db6c7ea9",
        "type": "ui_text",
        "z": "0abb9dc2d326cf1b",
        "group": "8f214c59.22bec",
        "order": 6,
        "width": 0,
        "height": 0,
        "name": "Reactive Power",
        "label": "VariAmps Reactive Power",
        "format": "{{msg.payload}}",
        "layout": "row-center",
        "className": "",
        "x": 1000,
        "y": 260,
        "wires": [],
        "icon": "node-red/alert.svg"
    },
    {
        "id": "945812e5afd9f9aa",
        "type": "ui_text",
        "z": "0abb9dc2d326cf1b",
        "group": "8f214c59.22bec",
        "order": 7,
        "width": 0,
        "height": 0,
        "name": "Apparent Power",
        "label": "VariAmps Apparent Power ",
        "format": "{{msg.payload}}",
        "layout": "row-center",
        "className": "",
        "x": 1010,
        "y": 220,
        "wires": [],
        "icon": "node-red/alert.svg"
    },
    {
        "id": "95dcfceed20e7d08",
        "type": "ui_gauge",
        "z": "0abb9dc2d326cf1b",
        "name": "Power in Watts ",
        "group": "8f214c59.22bec",
        "order": 8,
        "width": 0,
        "height": 0,
        "gtype": "gage",
        "title": " Power / Watts",
        "label": "Watts ",
        "format": "{{value}}",
        "min": 0,
        "max": 10,
        "colors": [
            "#00b500",
            "#e6e600",
            "#ca3838"
        ],
        "seg1": "",
        "seg2": "",
        "className": "",
        "x": 1000,
        "y": 180,
        "wires": []
    },
    {
        "id": "2886fa70283df190",
        "type": "change",
        "z": "0abb9dc2d326cf1b",
        "name": "prepare influx insert",
        "rules": [
            {
                "t": "set",
                "p": "payload",
                "pt": "msg",
                "to": "[\t    {\t        \"total\": msg.payload.ENERGY.Total,\t        \"yesterday\": msg.payload.ENERGY.Yesterday,\t        \"today\": msg.payload.ENERGY.Total,\t        \"period\": msg.payload.ENERGY.Period,\t        \"power\": msg.payload.ENERGY.Power,\t        \"apparentPower\": msg.payload.ENERGY.ApparentPower,\t        \"reactivePower\": msg.payload.ENERGY.ReactivePower,\t        \"powerFactor\": msg.payload.ENERGY.Factor,\t        \"voltage\": msg.payload.ENERGY.Voltage,\t        \"current\": msg.payload.ENERGY.Current\t    },{\t        \"sensor\": $split(msg.topic,'/')[1]\t    }\t]\t",
                "tot": "jsonata"
            }
        ],
        "action": "",
        "property": "",
        "from": "",
        "to": "",
        "reg": false,
        "x": 460,
        "y": 380,
        "wires": [
            [
                "27b3a4db.fab30c",
                "fb488532bff55ae6"
            ]
        ]
    },
    {
        "id": "fdc5662e2657f640",
        "type": "debug",
        "z": "0abb9dc2d326cf1b",
        "name": "",
        "active": true,
        "tosidebar": true,
        "console": false,
        "tostatus": false,
        "complete": "true",
        "targetType": "full",
        "statusVal": "",
        "statusType": "auto",
        "x": 190,
        "y": 460,
        "wires": []
    },
    {
        "id": "f1bf29a0246742ee",
        "type": "mqtt in",
        "z": "0abb9dc2d326cf1b",
        "name": "",
        "topic": "tele/+/STATE",
        "qos": "0",
        "datatype": "json",
        "broker": "e40a6e76.c9f3d",
        "nl": false,
        "rap": false,
        "rh": "0",
        "inputs": 0,
        "x": 110,
        "y": 540,
        "wires": [
            [
                "fdc5662e2657f640",
                "dadbbd78ef636630"
            ]
        ]
    },
    {
        "id": "fb488532bff55ae6",
        "type": "influxdb out",
        "z": "0abb9dc2d326cf1b",
        "influxdb": "31eb6050bebfe505",
        "name": "insert acpower",
        "measurement": "acpower",
        "precision": "",
        "retentionPolicy": "",
        "database": "database",
        "precisionV18FluxV20": "ms",
        "retentionPolicyV18Flux": "",
        "org": "organisation",
        "bucket": "bucket",
        "x": 720,
        "y": 380,
        "wires": []
    },
    {
        "id": "dadbbd78ef636630",
        "type": "change",
        "z": "0abb9dc2d326cf1b",
        "name": "prepare influx insert",
        "rules": [
            {
                "t": "set",
                "p": "payload",
                "pt": "msg",
                "to": "[\t    {\t        \"uptime\": msg.payload.UptimeSec,\t        \"heap\": msg.payload.Heap,\t        \"sleepMode\": msg.payload.SleepMode,\t        \"sleep\": msg.payload.Sleep,\t        \"loadAvg\": msg.payload.LoadAvg,\t        \"mqttCount\": msg.payload.MqttCount,\t        \"power\": msg.payload.POWER\t    },{\t        \"sensor\": $split(msg.topic,'/')[1]\t    }\t]\t",
                "tot": "jsonata"
            }
        ],
        "action": "",
        "property": "",
        "from": "",
        "to": "",
        "reg": false,
        "x": 460,
        "y": 540,
        "wires": [
            [
                "b8c9cbadac0773e8",
                "27b3a4db.fab30c"
            ]
        ]
    },
    {
        "id": "b8c9cbadac0773e8",
        "type": "influxdb out",
        "z": "0abb9dc2d326cf1b",
        "influxdb": "31eb6050bebfe505",
        "name": "insert status",
        "measurement": "status",
        "precision": "",
        "retentionPolicy": "",
        "database": "database",
        "precisionV18FluxV20": "ms",
        "retentionPolicyV18Flux": "",
        "org": "organisation",
        "bucket": "bucket",
        "x": 710,
        "y": 540,
        "wires": []
    },
    {
        "id": "e40a6e76.c9f3d",
        "type": "mqtt-broker",
        "name": "",
        "broker": "mosquitto",
        "port": "1883",
        "clientid": "",
        "autoConnect": true,
        "usetls": false,
        "protocolVersion": "4",
        "keepalive": "60",
        "cleansession": true,
        "birthTopic": "",
        "birthQos": "0",
        "birthRetain": "false",
        "birthPayload": "",
        "birthMsg": {},
        "closeTopic": "",
        "closeRetain": "false",
        "closePayload": "",
        "closeMsg": {},
        "willTopic": "",
        "willQos": "0",
        "willRetain": "false",
        "willPayload": "",
        "willMsg": {},
        "sessionExpiry": ""
    },
    {
        "id": "8f214c59.22bec",
        "type": "ui_group",
        "name": "Sonoff POW",
        "tab": "6b25e5f4.b44ecc",
        "order": 1,
        "disp": true,
        "width": "6",
        "collapse": false,
        "className": ""
    },
    {
        "id": "31eb6050bebfe505",
        "type": "influxdb",
        "hostname": "influxdb",
        "port": "8086",
        "protocol": "http",
        "database": "sonoffpow",
        "name": "",
        "usetls": false,
        "tls": "",
        "influxdbVersion": "1.x",
        "url": "http://localhost:8086",
        "rejectUnauthorized": true
    },
    {
        "id": "6b25e5f4.b44ecc",
        "type": "ui_tab",
        "name": "Tasmota Control",
        "icon": "dashboard",
        "disabled": false,
        "hidden": false
    }
]

Sample data that made it to Influx:

$ docker exec -it influxdb influx -precision=rfc3339

> use sonoffpow
Using database sonoffpow

> show series
key
---
acpower,sensor=sonoffpow
status,sensor=sonoffpow

> select * from acpower
name: acpower
time                           apparentPower current period power powerFactor reactivePower sensor    today total voltage yesterday
----                           ------------- ------- ------ ----- ----------- ------------- ------    ----- ----- ------- ---------
2022-01-04T03:06:55.199690005Z 42            0.351   0      23    0.56        35            sonoffpow 0.612 0.612 120     0.027
2022-01-04T03:19:18.518436829Z 42            0.351   0      23    0.56        35            sonoffpow 0.612 0.612 120     0.027
2022-01-04T03:20:45.937055418Z 42            0.351   0      23    0.56        35            sonoffpow 0.612 0.612 120     0.027
2022-01-04T03:20:46.963298527Z 42            0.353   0      23    0.54        36            sonoffpow 0.613 0.613 120     0.027
2022-01-04T03:20:48.006427967Z 42            0.35    0      25    0.59        34            sonoffpow 0.613 0.613 120     0.027
2022-01-04T03:20:48.999652464Z 43            0.36    0      25    0.57        35            sonoffpow 0.613 0.613 120     0.027

> select * from status
name: status
time                           heap loadAvg mqttCount power sensor    sleep sleepMode uptime
----                           ---- ------- --------- ----- ------    ----- --------- ------
2022-01-04T03:18:52.568022751Z 27   19      1         ON    sonoffpow 50    Dynamic   129

> exit
$

And, finally:

Screen Shot 2022-01-04 at 14 44 45

@Paraphraser
Copy link
Author

Didn't know Node-RED came pre-installed. It's up to you. These days, I'm pretty much prefer a container over any other approach for just about anything.

@larduino
Copy link

larduino commented Jan 4, 2022

I had the Sonoff POW from a couple years ago - never got it working with EspEasy firmware.
The other day I got the Sonoff POW out and flashed it with Tasmota and it works !
It has the regular display screen with all the power data and also the on off toggle.
Then the Tasmota has setup screens for MQTT and other things - really nice setup.
I have already been using it with plugs installed on it to test various AC circuits and see what is going on with loads. Pretty nice for $10. I just ordered two more of their revised POW R2 which I guess is a bit better .
Regarding the Node Red flow I have - it is a hodge podge of downloading the flows of other people and then trying to modify them to work.
And I know what you mean about getting corrupted flows - some people have some posted and I can't get them to load and spent time trying to figure out syntax errors, etc.
So now I am going to spend some time studying the flow which you kindly made and shared with me . I do appreciate it . After spending days reading up on this and that what you shared should make some sense to me - I hope !
Here are screen shots from the Tasmota webpage installed in the Sonoff POW.
tasmoda

tasmota

@Paraphraser
Copy link
Author

🥳 - graphics!

Aside from the standard benefits of containerisation (someone else does all the maintenance work, easy to pin to earlier versions if an update breaks something, or test new versions in a controlled manner before committing to them, "no surprises" because two processes try to futz with the same part of your OS - they can't because containerisation stops them), you should think about the efficiency of traffic flows. A device like the sonoff speaks. Its MQTT traffic arrives at the RPi where Docker is listening on port 1883. Docker uses Network Address Translation (NAT) to forward the packet to the container's port 1883. The entire TCP exchange in each direction goes through NAT and the packets are routed (Layer Three) in and out of container space. If NodeRed and Influx are both running as containers like Mosquitto then all the remaining traffic interactions occur within containerspace so it's like a Layer Two switch - unicast traffic is point-to-point across the internal subnet. If NodeRed runs outside container space then its subscriptions to Mosquitto and its "insert" instructions to Influx all have to undergo bi-directional NAT and be routed in and out of containerspace. It works but ... yech.

Also, NodeRed graphics are a good way to get started but I think you'll quickly grow tired of their limitations. I bet the question you'll be asking in a few days is "why don't the measurements shown in the graphs persist if I restart NodeRed?" Because they don't. You can make NodeRed do it but it's quite ugly.

Grafana, on the other hand, has all this down pat. One of the things I really like is having a running dashboard of last week's voltage being updated every 10 seconds. If I notice spike I can just rubber-band the area and zoom in on the period in question without a second thought. The histogram associated with the graph of voltage by time just follows along giving me the distribution. Quite neat, really. It's a great app.

I suppose the best advice I can give you is to not waste too much time trying to make NodeRed do graphics. You have devices. They send telemetry to Mosquitto - it's the concentrator. Node-Red is the traffic cop saying where the data should be stored in Influx. Grafana is the display engine, ferreting data out of influx tables and combining it in interesting ways. Node-Red is good at things like alerts but Grafana has those too so it's a matter of taste and features. Influx is also good at chucking data away or aggregating it in useful ways. Example, do I really need 10-second voltage data from five years ago or would the maximum voltage in each minute, five minutes, 30 minutes, hour, etc be more appropriate? Influx can handle that. Each component in the MING stack is well worth the learning curve.

@Paraphraser
Copy link
Author

In "full topic" it's not clear where %prefix% is coming from but it does seem reasonably clear that Tasmota expects the second part of the topic string to be the device discriminator. That's why it defaults to "tasmota" followed by what is probably derived from the WiFi MAC address of the ESP8266 chip. The point is to think about what you want to call these things. If you get it "right" (which is entirely dependent on your needs and goals) that flow will automatically handle new sonoffs correctly. They'll just show up as new series in the database.

@larduino
Copy link

larduino commented Jan 4, 2022

I totally understand what you are saying about Node Red Graphics compared to Grafana. As you may remember I have a very nice Grafana dashboard displaying my solar system data and it works great and as you say I can look backwards and zoom in. The graphics I had on Node Red example were ones I downloaded from someone else and it was helpful in me learning some things- since it didn't work I figured out the problems in the code in it.
I will uninstall the built in node red ( or leave it there ) and I will use IOTStack to install container Node Red. I really like using Portainer to see what is going on - makes it easy to look at logs, get in via the console, restart , etc.
The flow you made is running perfectly with no errors .I am studying your code in the change node and the effect it had on the output . I haven't set up the influx database for it yet and tried it in Grafana - that may have to be tomorrow. I may try to get to sleep tonight before 2 AM .
Thanks again - i really appreciate that you share your knowledge .

@Paraphraser
Copy link
Author

I chat with so many people on GitHub and Discord that I can't remember who has shown me what. That often leads me to make poor assumptions. Sorry. I'm glad that the flow is working for you.

@larduino
Copy link

larduino commented Jan 6, 2022

I removed the Node Red that came on Pi, then used IOTStack to load container Node Red. Everything worked out fine . I was also able to get the Influxdb part working and linked up to Grafana .

Sign up for free to join this conversation on GitHub. Already have an account? Sign in to comment