Week 5 of MLOps Zoomcamp
Link to Course: https://github.com/DataTalksClub/mlops-zoomcamp
Our ML production models are production software and thus face the same problems faced by other production SE/SD software. However, in addition to these general issues, certain ML-specific issues may occur in ML production models that don't in SE/SD. As such, SE/SD tools are not sufficient to monitor ML production models.
Monitoring ML models is mostly around monitoring four sectors:
- Service Health: General Software health check
- Model Performance: Depending on metrics for the problem
- Data Quality and integrity
- Data Drift & Concept Drift
Over time, ML models may degrade. This is due to one of two effects:
- Data Drift: In which new input data is no longer represented by the model's training dataset. Example: 3 new popular venues were opened in the last month, our Taxi duration model hasn't got samples of this new data in its training dataset
- Concept Drift: In which the concept changes, i.e: The relationship between inputs and outputs has changed (Not necessarily the data itself however).This drift as the name implies is due to "concepts" (i.e: hidden variables, underpinning hypotheses..etc) changing. Example: Taxi cars have been replaced by newer, faster, nimbler cars. Our model can no longer accurately predict trip durations
In a more comprehensive setting, we may as well monitor 4 criteria:
- Performance by Segment: Performance in each segment of the input distribution
- Model bias/fairness
- Outliers
- Explainability
In Batch Models, we implement batch monitoring. We add some calculation block after step in the pipeline and run some checks to make sure that the model behaves as expected. In other words:
- Calculate performance metrics and health metrics
- Log the metrics in a SQL or NoSQL database
- Build a report
In real-time served models, we may want to keep a closer live look on how the model performs. We add a service that pulls metrics and update the visuals in real time.
Sometimes, despite the model being online, we may want to monitor the model in Batch mode as well. As certain issues in the model may only manifest themselves over a longer timespan or larger dataset, such as Data Drift and Concept Drift.
In this week, we want to monitor our previously deployed Taxi duration predictor See here. In particular, we want to monitor our Backend model.
In this monitoring deployment, we want both Online monitoring via Prometheus and Grafana as well as Offline monitoring via EvidentlyAI:
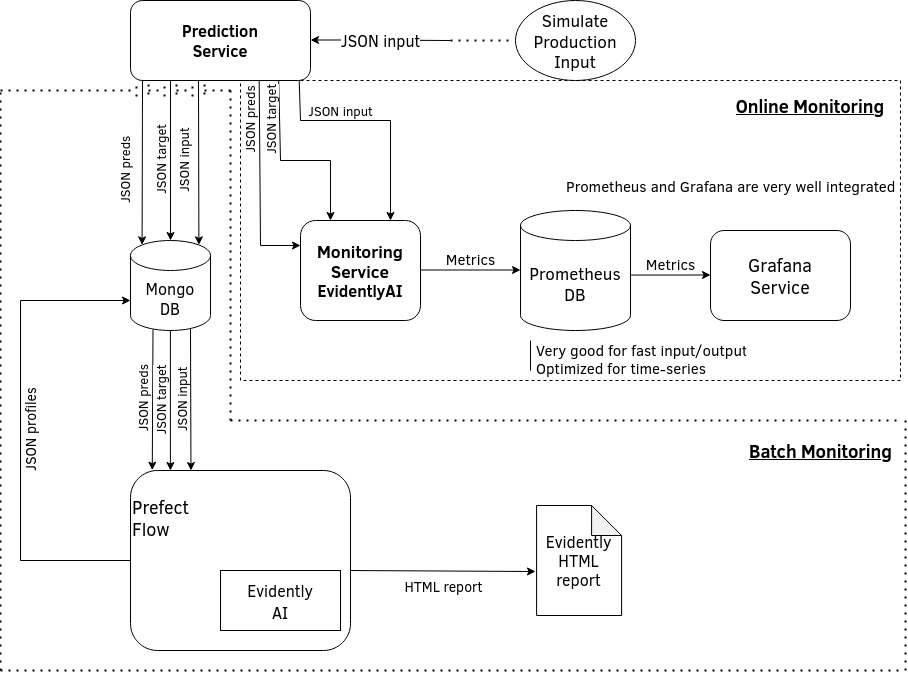
For Batch Learning, we need three components:
- Prediction Service
- Evidently Service
- MongoDB, Prometheus and Grafana
We also need a few packages outside the containers:
#! requirements.txt
scikit-learn
dataclasses==0.6
Flask~=2.0.1
pandas>=1.1.5
Werkzeug~=2.0.1
requests~=2.26.0
prometheus_client~=0.11.0
pyyaml~=5.4.1
tqdm
pyarrow
prefect>=2.0b
pymongo
evidently
The prediction file we start with is the same as that of week4 with only the Backend prediction (No streaming). Starting from this file, we add two methods; Saving to MongoDB to log everything to MongoDB, and Saving to Evidently's Service for monitoring.
MONGODB_ADDRESS = os.getenv('MONGODB_ADDRESS','mongodb://127.0.0.1:27017')

mongo_client = MongoClient(MONGODB_ADDRESS)
db = mongo_client.get_database('prediction_service')
collection = db.get_collection('data')

def save_to_db(record, prediction):
  rec = record.copy()
  rec['prediction'] = prediction
  collection.insert_one(rec)
With the MongoDB running on the mentioned address.
EVIDENTLY_SERVICE_ADDRESS = os.getenv('EVIDENTLY_SERVICE', 'http://127.0.0.1:5000'


def save_to_evidently_service(record, prediction):
    rec = recort.copy()
    rec['prediction'] = prediction
    requests.post(f"{EVIDENTLY_SERVICE_ADDRESS}/iterate/taxi", json=rec)
The JSON to save is simply POSTed to the Evidently Service Address. /iterate/taxi is the path, where taxi is the experiment's name.
The final file will look like:
#! app.py

import os
import base64
import requests
import pickle

import pandas as pd

from sklearn.linear_model import LinearRegression
from sklearn.feature_extraction import DictVectorizer

from preprocess_simple_green import preprocess_dict

import json

from flask import Flask, request, jsonify

from pymongo import MongoClient

MODEL_FILE = os.getenv('MODEL_FILE', 'model.pkl')
DV_FILE = os.getenv('DV_FILE', 'dv_simple_linreg.pkl')
MONGODB_ADDRESS = os.getenv('MONGODB_ADDRESS', 'mongodb://127.0.0.1:27017')
EVIDENTLY_SERVICE_ADDRESS = os.getenv('EVIDENTLY_SERVICE', 'http://127.0.0.1:5000')

mongo_client = MongoClient(MONGODB_ADDRESS)
db = mongo_client.get_database('prediction_service')
collection = db.get_collection('data')

with open(DV_FILE, 'rb') as f_in:
    dv = pickle.load(f_in)

with open(MODEL_FILE, 'rb') as f_in:
    lr = pickle.load(f_in)

def predict_features(features):
    X = dv.transform(features)

    return round(lr.predict(X)[0])

def save_to_db(record, prediction):
    rec = record.copy()
    rec['prediction'] = prediction
    collection.insert_one(rec)

def save_to_evidently_service(record, prediction):
    rec = record.copy()
    rec['prediction'] = prediction
    requests.post(f"{EVIDENTLY_SERVICE_ADDRESS}/iterate/taxi", json=rec)

app = Flask('duration')

@app.route('/predict',methods=['POST'])

def predict():
    ride = request.get_json()

    features = preprocess_dict(ride)

    #return features
    pred_init = predict_features(features)
    print("Finished backend prediction")

    return_dict = {'duration_init': pred_init}

    save_to_db(ride, pred_init)
    save_to_evidently_service(ride, pred_init)

    return jsonify(return_dict)

if __name__ == '__main__':
    app.run(debug=True, host='localhost', port=9696)
The prediction service app's Docker container (see week4 notes) will be contained in a subfolder named prediction_services. This will be our first container.
The backend sends data to the Evidently Service to calculate metrics. The resulting metrics are then logged into a PrometheusDB which will be accessed by Grafana to create a Dashboard.
For the Evidently Service container, we use the files provided by instructors.
We also need some parquet files beforehand. These are packaged in the prepare.py file.
The Evidently Service is primarly composed of the Monitoring Service. Itself calling the different monitors provided by Evidently to assess the quality of the model, such as Data Drift, Data Quality...etc. We then call the iterate method of the Monitoring Service class to calculate the different metrics, and push the metrics to the PrometheusDB (each metric in its own "Gauge" object) for the Grafana dashboard.
Evidently takes certain parameters for initialization. Chief among which:
use_referenceanddataset_path: for the reference dataset; Mandatory for certain metrics like Data Driftwindow_size: The data window for which the metrics are calculated; The larger it is, the more past values are used
Each Dataset used in Evidently also needs some parameters; Namely column_mapping which tells Evidently which columns are numerical/categorical/...
All these parameters are taken into Evidently via a config.yaml file. The Evidently Service proper is called through a Flask API after the Service is initialized. Each time a new value is output, a JSON is sent to iterate/[dataset name](ex: localhost:8085/iterate/taxi) and is ran through the Service.
For Prometheus and Grafana we use configurations provided by the instructors. While for the MongoDB container, we use the container on DockerHub.
The dashboards created by Evidently are also configured via the files given by the instructors.
(See prefect_example.py)
In Batch Learning, we periodically run a service and create an HTML report.
- The service reads the data from MongoDB
- Updates the data with the target row
- Runs the model over the reference data
- Runs the metrics over the data from MongoDB using the reference data [as reference]
- Creates Dashboards
- Inserts the resulting metrics to MongoDB
- Saves the HTML report
This is all wrapped in a Prefect flow (See week3), preferably in a deployment environment to automate it to run periodically.