-
-
Save bendichter/d7dccacf55c7d95aec05c6e7bcf4e66e to your computer and use it in GitHub Desktop.
| # MIT LICENSE | |
| import datetime | |
| import plotly.graph_objs as go | |
| from plotly.subplots import make_subplots | |
| import numpy as np | |
| import dash_core_components as dcc | |
| import dash_html_components as html | |
| import dash | |
| def display_year( | |
| z, | |
| year: int = None, | |
| month_lines: bool = True, | |
| fig=None, | |
| row: int = None | |
| ): | |
| if year is None: | |
| year = datetime.datetime.now().year | |
| d1 = datetime.date(year, 1, 1) | |
| d2 = datetime.date(year, 12, 31) | |
| number_of_days = (d2-d1).days + 1 | |
| data = np.ones(number_of_days) * np.nan | |
| data[:len(z)] = z | |
| d1 = datetime.date(year, 1, 1) | |
| d2 = datetime.date(year, 12, 31) | |
| delta = d2 - d1 | |
| month_names = ['Jan', 'Feb', 'Mar', 'Apr', 'May', 'Jun', 'Jul', 'Aug', 'Sep', 'Oct', 'Nov', 'Dec'] | |
| month_days = [31, 28, 31, 30, 31, 30, 31, 31, 30, 31, 30, 31] | |
| if number_of_days == 366: # leap year | |
| month_days[1] = 29 | |
| month_positions = (np.cumsum(month_days) - 15)/7 | |
| dates_in_year = [d1 + datetime.timedelta(i) for i in range(delta.days+1)] # list with datetimes for each day a year | |
| weekdays_in_year = [i.weekday() for i in dates_in_year] # gives [0,1,2,3,4,5,6,0,1,2,3,4,5,6,…] (ticktext in xaxis dict translates this to weekdays | |
| weeknumber_of_dates = [] | |
| for i in dates_in_year: | |
| inferred_week_no = int(i.strftime("%V")) | |
| if inferred_week_no >= 52 and i.month == 1: | |
| weeknumber_of_dates.append(0) | |
| elif inferred_week_no == 1 and i.month == 12: | |
| weeknumber_of_dates.append(53) | |
| else: | |
| weeknumber_of_dates.append(inferred_week_no) | |
| text = [str(i) for i in dates_in_year] #gives something like list of strings like ‘2018-01-25’ for each date. Used in data trace to make good hovertext. | |
| #4cc417 green #347c17 dark green | |
| colorscale=[[False, '#eeeeee'], [True, '#76cf63']] | |
| # handle end of year | |
| data = [ | |
| go.Heatmap( | |
| x=weeknumber_of_dates, | |
| y=weekdays_in_year, | |
| z=data, | |
| text=text, | |
| hoverinfo='text', | |
| xgap=3, # this | |
| ygap=3, # and this is used to make the grid-like apperance | |
| showscale=False, | |
| colorscale=colorscale | |
| ) | |
| ] | |
| if month_lines: | |
| kwargs = dict( | |
| mode='lines', | |
| line=dict( | |
| color='#9e9e9e', | |
| width=1, | |
| ), | |
| hoverinfo='skip', | |
| ) | |
| for date, dow, wkn in zip( | |
| dates_in_year, weekdays_in_year, weeknumber_of_dates | |
| ): | |
| if date.day == 1: | |
| data += [ | |
| go.Scatter( | |
| x=[wkn-.5, wkn-.5], | |
| y=[dow-.5, 6.5], | |
| **kwargs, | |
| ) | |
| ] | |
| if dow: | |
| data += [ | |
| go.Scatter( | |
| x=[wkn-.5, wkn+.5], | |
| y=[dow-.5, dow - .5], | |
| **kwargs, | |
| ), | |
| go.Scatter( | |
| x=[wkn+.5, wkn+.5], | |
| y=[dow-.5, -.5], | |
| **kwargs, | |
| ) | |
| ] | |
| layout = go.Layout( | |
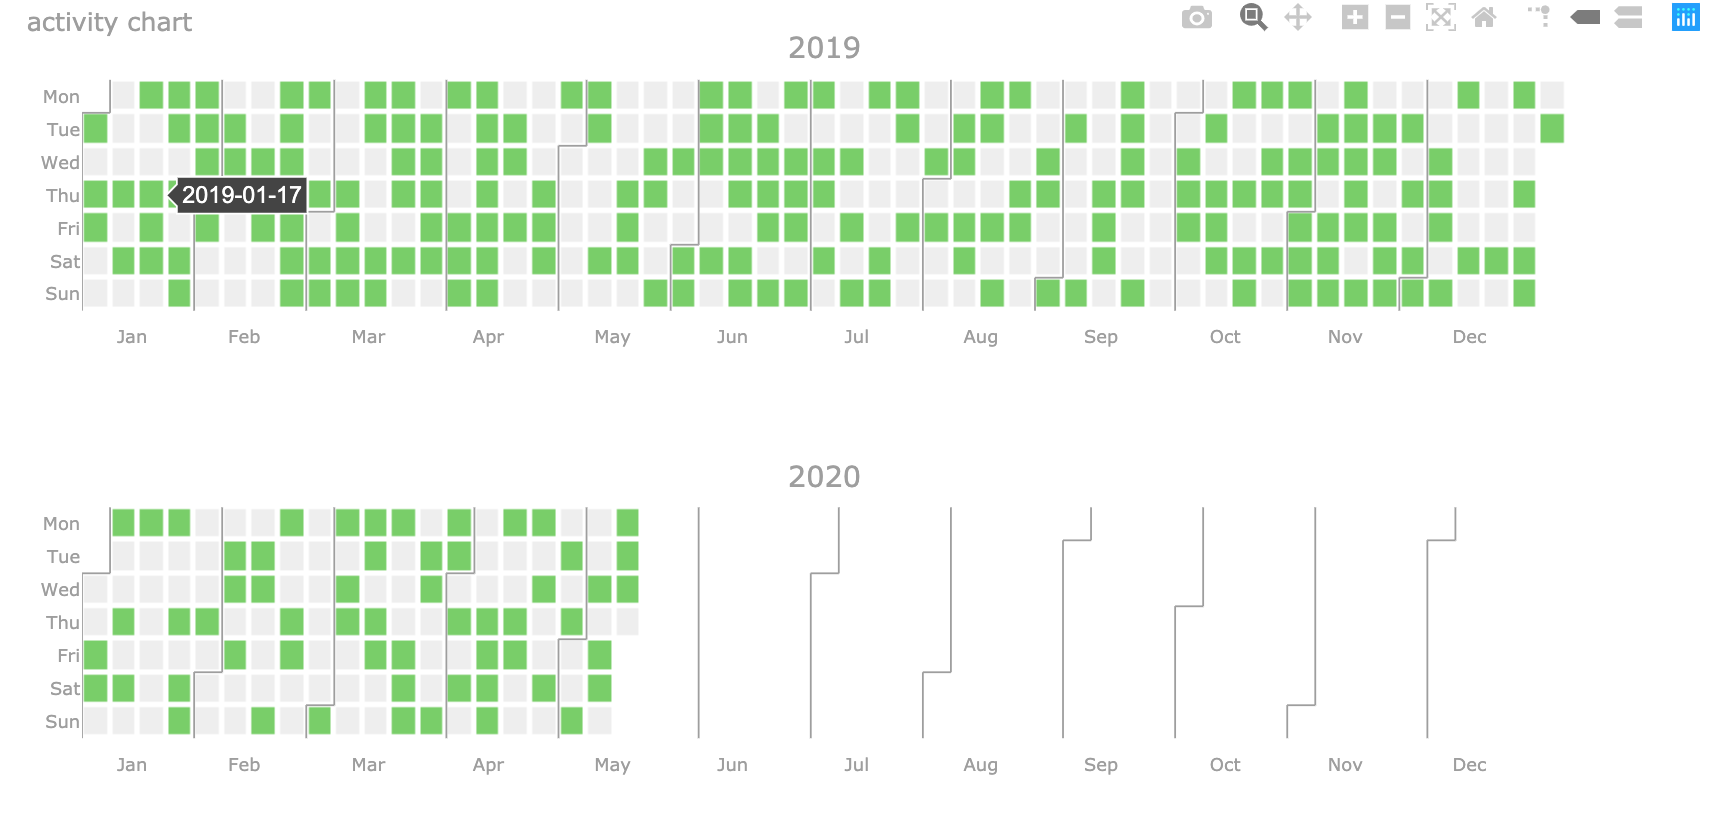
| title='activity chart', | |
| height=250, | |
| yaxis=dict( | |
| showline=False, showgrid=False, zeroline=False, | |
| tickmode='array', | |
| ticktext=['Mon', 'Tue', 'Wed', 'Thu', 'Fri', 'Sat', 'Sun'], | |
| tickvals=[0, 1, 2, 3, 4, 5, 6], | |
| autorange="reversed", | |
| ), | |
| xaxis=dict( | |
| showline=False, showgrid=False, zeroline=False, | |
| tickmode='array', | |
| ticktext=month_names, | |
| tickvals=month_positions, | |
| ), | |
| font={'size':10, 'color':'#9e9e9e'}, | |
| plot_bgcolor=('#fff'), | |
| margin = dict(t=40), | |
| showlegend=False, | |
| ) | |
| if fig is None: | |
| fig = go.Figure(data=data, layout=layout) | |
| else: | |
| fig.add_traces(data, rows=[(row+1)]*len(data), cols=[1]*len(data)) | |
| fig.update_layout(layout) | |
| fig.update_xaxes(layout['xaxis']) | |
| fig.update_yaxes(layout['yaxis']) | |
| return fig | |
| def display_years(z, years): | |
| day_counter = 0 | |
| fig = make_subplots(rows=len(years), cols=1, subplot_titles=years) | |
| for i, year in enumerate(years): | |
| d1 = datetime.date(year, 1, 1) | |
| d2 = datetime.date(year, 12, 31) | |
| number_of_days = (d2-d1).days + 1 | |
| data = z[day_counter : day_counter + number_of_days] | |
| display_year(data, year=year, fig=fig, row=i) | |
| fig.update_layout(height=250*len(years)) | |
| day_counter += number_of_days | |
| return fig | |
| z = np.random.randint(2, size=(1200,)) | |
| display_years(z, (2020, 2021, 2022)) |
bendichter
commented
Dec 2, 2020
•
This is great, thank you!
I have a correction for your script. The year period should probally go from first date of week 1 until last day of the last week of the year.
 d1 = datetime.datetime.strptime(f'{year}-1-1', "%Y-%W-%w").date()
 d2 = datetime.datetime.strptime(f'{year}-{datetime.date(year, 12, 28).isocalendar()[1]}-0', "%Y-%W-%w").date()
It depends on how you want to see the offset days, but the current script does not work for 2021 - 2022
I made different solution that actually show the whole year now.
  weeknumber_of_dates = []
  for i in dates_in_year:
      inferred_week_no = int(i.strftime("%V"))
      if inferred_week_no >= 52 and i.month == 1:
          weeknumber_of_dates.append(0)
      elif inferred_week_no == 1 and i.month == 12:
          weeknumber_of_dates.append(53)
      else:
          weeknumber_of_dates.append(inferred_week_no)
And change the hardcoded 365 days to a calculate the days of the year since 2020 has 366 days.
d1 = datetime.date(year, 1, 1)
d2 = datetime.date(year, 12, 31)

number_of_days = (d2-d1).days + 1
thanks @bayees! With your held I improved this gist in the following ways:
- fixed import error
- account for leap years
- fix rendering of last week
This is great! One question though on line 40, should that be if number_of_days == 366: instead of if number_of_days == 266:? Leap year would just be added a day to a normal 365 day year, right?
@TPhil10 you are absolutely right. Thanks for catching that!
Thank you for this great visualization! I like to see the underlying value of a day in the hovertext. Therefore I changed your line 70 to: "hoverinfo='text+z',"
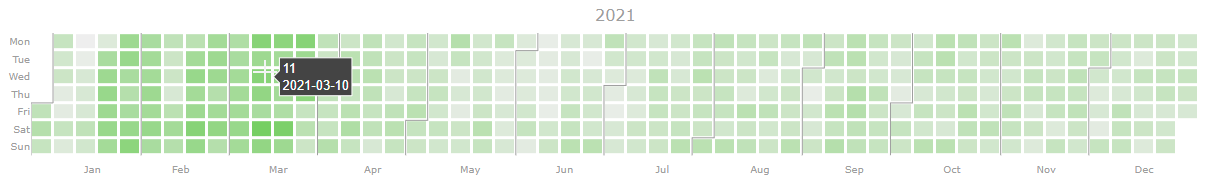
@bweisshaupt very cool!
Great visualization! 🎉
For someone who wants a weeknumber_of_dates that starts from 0 instead of 1, code from line 47 to 55 can be rewritten like this:
weeknumber_of_dates = []
week_n = 0
for i in weekdays_in_year:
    weeknumber_of_dates.append(week_n)
    if i == 6:
week_n += 1A great approach in my opinion, too. Thank you!
In my dash app under construction, however, I'd need this as a dash component with some configuration options.
- Display horizontally or vertically,
- In addition to month names on one side I'll need week numbers according to the preferred standard as given e.g. by epiweeks,
- Include marked holidays from different selected holiday calendars (e.g. bank holidays or national holidays for different countries),
- ... ?
Currently, it's not a priority for me, though.
Now I'll rather open Issue #16: Extension to calendar for picking dates instead