Last active
June 26, 2024 10:43
-
-
Save bendichter/d7dccacf55c7d95aec05c6e7bcf4e66e to your computer and use it in GitHub Desktop.
This file contains bidirectional Unicode text that may be interpreted or compiled differently than what appears below. To review, open the file in an editor that reveals hidden Unicode characters.
Learn more about bidirectional Unicode characters
| # MIT LICENSE | |
| import datetime | |
| import plotly.graph_objs as go | |
| from plotly.subplots import make_subplots | |
| import numpy as np | |
| import dash_core_components as dcc | |
| import dash_html_components as html | |
| import dash | |
| def display_year( | |
| z, | |
| year: int = None, | |
| month_lines: bool = True, | |
| fig=None, | |
| row: int = None | |
| ): | |
| if year is None: | |
| year = datetime.datetime.now().year | |
| d1 = datetime.date(year, 1, 1) | |
| d2 = datetime.date(year, 12, 31) | |
| number_of_days = (d2-d1).days + 1 | |
| data = np.ones(number_of_days) * np.nan | |
| data[:len(z)] = z | |
| d1 = datetime.date(year, 1, 1) | |
| d2 = datetime.date(year, 12, 31) | |
| delta = d2 - d1 | |
| month_names = ['Jan', 'Feb', 'Mar', 'Apr', 'May', 'Jun', 'Jul', 'Aug', 'Sep', 'Oct', 'Nov', 'Dec'] | |
| month_days = [31, 28, 31, 30, 31, 30, 31, 31, 30, 31, 30, 31] | |
| if number_of_days == 366: # leap year | |
| month_days[1] = 29 | |
| month_positions = (np.cumsum(month_days) - 15)/7 | |
| dates_in_year = [d1 + datetime.timedelta(i) for i in range(delta.days+1)] # list with datetimes for each day a year | |
| weekdays_in_year = [i.weekday() for i in dates_in_year] # gives [0,1,2,3,4,5,6,0,1,2,3,4,5,6,…] (ticktext in xaxis dict translates this to weekdays | |
| weeknumber_of_dates = [] | |
| for i in dates_in_year: | |
| inferred_week_no = int(i.strftime("%V")) | |
| if inferred_week_no >= 52 and i.month == 1: | |
| weeknumber_of_dates.append(0) | |
| elif inferred_week_no == 1 and i.month == 12: | |
| weeknumber_of_dates.append(53) | |
| else: | |
| weeknumber_of_dates.append(inferred_week_no) | |
| text = [str(i) for i in dates_in_year] #gives something like list of strings like ‘2018-01-25’ for each date. Used in data trace to make good hovertext. | |
| #4cc417 green #347c17 dark green | |
| colorscale=[[False, '#eeeeee'], [True, '#76cf63']] | |
| # handle end of year | |
| data = [ | |
| go.Heatmap( | |
| x=weeknumber_of_dates, | |
| y=weekdays_in_year, | |
| z=data, | |
| text=text, | |
| hoverinfo='text', | |
| xgap=3, # this | |
| ygap=3, # and this is used to make the grid-like apperance | |
| showscale=False, | |
| colorscale=colorscale | |
| ) | |
| ] | |
| if month_lines: | |
| kwargs = dict( | |
| mode='lines', | |
| line=dict( | |
| color='#9e9e9e', | |
| width=1, | |
| ), | |
| hoverinfo='skip', | |
| ) | |
| for date, dow, wkn in zip( | |
| dates_in_year, weekdays_in_year, weeknumber_of_dates | |
| ): | |
| if date.day == 1: | |
| data += [ | |
| go.Scatter( | |
| x=[wkn-.5, wkn-.5], | |
| y=[dow-.5, 6.5], | |
| **kwargs, | |
| ) | |
| ] | |
| if dow: | |
| data += [ | |
| go.Scatter( | |
| x=[wkn-.5, wkn+.5], | |
| y=[dow-.5, dow - .5], | |
| **kwargs, | |
| ), | |
| go.Scatter( | |
| x=[wkn+.5, wkn+.5], | |
| y=[dow-.5, -.5], | |
| **kwargs, | |
| ) | |
| ] | |
| layout = go.Layout( | |
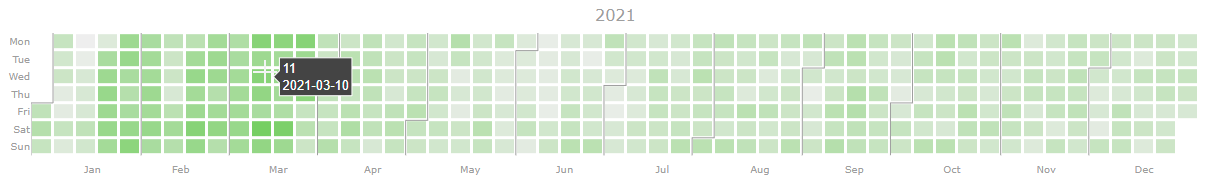
| title='activity chart', | |
| height=250, | |
| yaxis=dict( | |
| showline=False, showgrid=False, zeroline=False, | |
| tickmode='array', | |
| ticktext=['Mon', 'Tue', 'Wed', 'Thu', 'Fri', 'Sat', 'Sun'], | |
| tickvals=[0, 1, 2, 3, 4, 5, 6], | |
| autorange="reversed", | |
| ), | |
| xaxis=dict( | |
| showline=False, showgrid=False, zeroline=False, | |
| tickmode='array', | |
| ticktext=month_names, | |
| tickvals=month_positions, | |
| ), | |
| font={'size':10, 'color':'#9e9e9e'}, | |
| plot_bgcolor=('#fff'), | |
| margin = dict(t=40), | |
| showlegend=False, | |
| ) | |
| if fig is None: | |
| fig = go.Figure(data=data, layout=layout) | |
| else: | |
| fig.add_traces(data, rows=[(row+1)]*len(data), cols=[1]*len(data)) | |
| fig.update_layout(layout) | |
| fig.update_xaxes(layout['xaxis']) | |
| fig.update_yaxes(layout['yaxis']) | |
| return fig | |
| def display_years(z, years): | |
| day_counter = 0 | |
| fig = make_subplots(rows=len(years), cols=1, subplot_titles=years) | |
| for i, year in enumerate(years): | |
| d1 = datetime.date(year, 1, 1) | |
| d2 = datetime.date(year, 12, 31) | |
| number_of_days = (d2-d1).days + 1 | |
| data = z[day_counter : day_counter + number_of_days] | |
| display_year(data, year=year, fig=fig, row=i) | |
| fig.update_layout(height=250*len(years)) | |
| day_counter += number_of_days | |
| return fig | |
| z = np.random.randint(2, size=(1200,)) | |
| display_years(z, (2020, 2021, 2022)) |
@TPhil10 you are absolutely right. Thanks for catching that!
Thank you for this great visualization! I like to see the underlying value of a day in the hovertext. Therefore I changed your line 70 to: "hoverinfo='text+z',"
@bweisshaupt very cool!
Great visualization! 🎉
For someone who wants a weeknumber_of_dates that starts from 0 instead of 1, code from line 47 to 55 can be rewritten like this:
weeknumber_of_dates = []
week_n = 0
for i in weekdays_in_year:
    weeknumber_of_dates.append(week_n)
    if i == 6:
week_n += 1A great approach in my opinion, too. Thank you!
In my dash app under construction, however, I'd need this as a dash component with some configuration options.
- Display horizontally or vertically,
- In addition to month names on one side I'll need week numbers according to the preferred standard as given e.g. by epiweeks,
- Include marked holidays from different selected holiday calendars (e.g. bank holidays or national holidays for different countries),
- ... ?
Currently, it's not a priority for me, though.
Now I'll rather open Issue #16: Extension to calendar for picking dates instead
Sign up for free
to join this conversation on GitHub.
Already have an account?
Sign in to comment
This is great! One question though on line 40, should that be
if number_of_days == 366:instead ofif number_of_days == 266:? Leap year would just be added a day to a normal 365 day year, right?