- Ant Design - https://ant.design/
- Atlaskit by Atlassian - https://atlaskit.atlassian.com/
- Base Web by Uber - https://baseweb.design/
- Blueprint by Palantir - https://blueprintjs.com/
- Carbon by IBM - https://www.carbondesignsystem.com/
- Elastic UI by Elastic - https://elastic.github.io/eui/
- Evergreen by Segment - https://evergreen.segment.com/
Chris Parmer chriddyp
chriddyp
/ custom-keybindings.sublime-keymap
Last active
October 19, 2021 15:10
Custom Sublime Text keybindings for rapid code navigation. No arrow keys required!
This file contains bidirectional Unicode text that may be interpreted or compiled differently than what appears below. To review, open the file in an editor that reveals hidden Unicode characters.
Learn more about bidirectional Unicode characters
Show hidden characters
| [ | |
| /* Navigate quickly through a file - Move by horizontally words and vertically by blocks */ | |
| { "keys": ["ctrl+l"], "command": "move", "args": {"by": "subwords", "forward": true}}, | |
| { "keys": ["ctrl+j"], "command": "move", "args": {"by": "subwords", "forward": false}}, | |
| { "keys": ["ctrl+option+k"], "command": "move", "args": {"by": "stops", "forward": true, "empty_line": true}}, | |
| { "keys": ["ctrl+option+i"], "command": "move", "args": {"by": "stops", "forward": false, "empty_line": true}}, | |
| /* Fine-grained navigation - Move horizontally by characters and vertically by lines */ | |
| { "keys": ["ctrl+option+l"], "command": "move", "args": {"by": "characters", "forward": true}}, | |
| { "keys": ["ctrl+option+j"], "command": "move", "args": {"by": "characters", "forward": false}}, |
nicolaskruchten
/ app.py
Last active
November 13, 2019 05:08
This file contains bidirectional Unicode text that may be interpreted or compiled differently than what appears below. To review, open the file in an editor that reveals hidden Unicode characters.
Learn more about bidirectional Unicode characters
| import dash | |
| from dash.dependencies import Input, Output | |
| import dash_core_components as dcc | |
| import dash_html_components as html | |
| import plotly.express as px | |
| gapminder = px.data.gapminder().query("year == 2007") | |
| input_figure = px.scatter(gapminder, x="gdpPercap", y="lifeExp", size="pop", | |
| custom_data=[gapminder.index], # this is the special bit! |
manigandham
/ ui-frameworks.md
Last active
October 29, 2023 12:26
anandology
/ rdash.py
Created
June 22, 2017 06:21
POC implementation of reactive expressions for Dash
This file contains bidirectional Unicode text that may be interpreted or compiled differently than what appears below. To review, open the file in an editor that reveals hidden Unicode characters.
Learn more about bidirectional Unicode characters
| """Reactive expressions for Dash! | |
| Dash[1] is an interesting project build reactive web applications in Python. | |
| While the ideas are exciting, the syntax for specifying custom code is way | |
| too complicated that it should be. | |
| Here is a sample code to display sum of two input values. | |
| @app.callback( | |
| [Input(component_id='x', component_property='value')] |
chriddyp
/ dash_simple_example_pandas_datareader.py
Last active
March 26, 2024 01:05
This file contains bidirectional Unicode text that may be interpreted or compiled differently than what appears below. To review, open the file in an editor that reveals hidden Unicode characters.
Learn more about bidirectional Unicode characters
| # See official docs at https://dash.plotly.com | |
| # pip install dash pandas | |
| from dash import Dash, dcc, html, Input, Output | |
| import plotly.express as px | |
| import pandas as pd | |
| df = pd.read_csv('https://raw.githubusercontent.com/plotly/datasets/master/gapminderDataFiveYear.csv') |
This file contains bidirectional Unicode text that may be interpreted or compiled differently than what appears below. To review, open the file in an editor that reveals hidden Unicode characters.
Learn more about bidirectional Unicode characters
| ### generate questionnaire data | |
| library(triangle) | |
| set.seed(0) | |
| q1_d1 <- round(rtriangle(1000, 1, 7, 5)) | |
| q1_d2 <- round(rtriangle(1000, 1, 7, 6)) | |
| q1_d3 <- round(rtriangle(1000, 1, 7, 2)) |
First your need plotly npm package, and a plotly account.
npm install plotly
export PLOTLY_USERNAME=<plotly-username>
export PLOTLY_APIKEY=<plotly-apikey>
export MAPBOX_ACCESS_TOKEN=<your-mapbox-token>
To generate a image:
curl --silent "https://api.mapbox.com/analytics/v1/accounts/?period=2016-01-01,2016-04-29&access_token=$MAPBOX_ACCESS_TOKEN" | ./render-image.js > chart.png
avimar
/ restify lets-encrypt
Created
February 1, 2016 06:10
This file contains bidirectional Unicode text that may be interpreted or compiled differently than what appears below. To review, open the file in an editor that reveals hidden Unicode characters.
Learn more about bidirectional Unicode characters
| var myURL="mydomain.com"; | |
| var restifyOptions={} | |
| restifyOptions.certificate = fs.readFileSync('PathTo:fullchain.pem'); | |
| restifyOptions.key = fs.readFileSync('PathTo:privkey.pem'); | |
| var server = restify.createServer(restifyOptions); | |
| var nonSecure = restify.createServer({name: 'redirectToSSL'}); | |
| nonSecure.get(/.*/,function (req, res, next) { | |
| res.redirect(301, 'https://' + myURL + req._url.href, next); |
gtallen1187
/ slope_vs_starting.md
Created
November 2, 2015 00:02
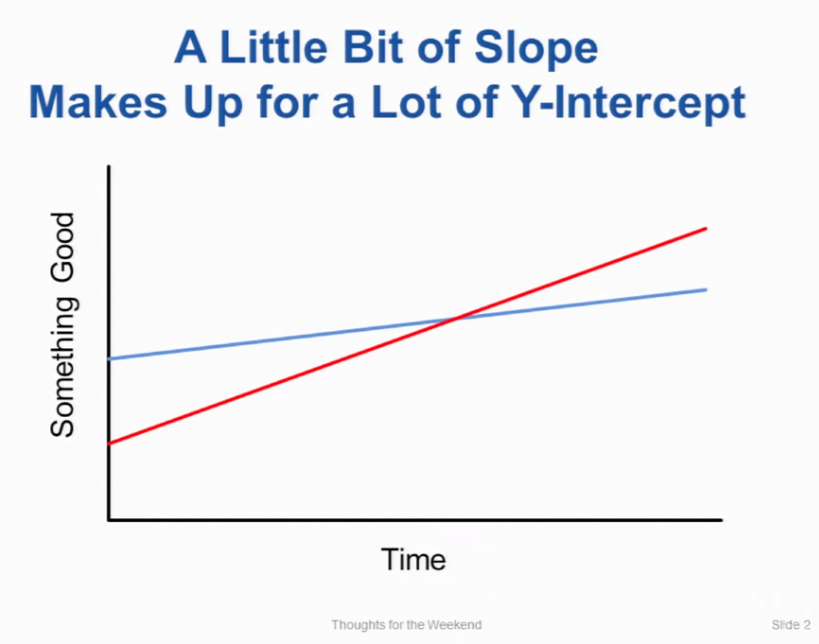
A little bit of slope makes up for a lot of y-intercept
NewerOlder