-
-
Save chriswhong/694779bc1f1e5d926e47bab7205fa559 to your computer and use it in GitHub Desktop.
| // custom mapbopx-gl-draw mode that modifies draw_line_string | |
| // shows a center point, radius line, and circle polygon while drawing | |
| // forces draw.create on creation of second vertex | |
| import MapboxDraw from 'mapbox-gl-draw'; | |
| import numeral from 'numeral'; | |
| import lineDistance from 'npm:@turf/line-distance'; | |
| const RadiusMode = MapboxDraw.modes.draw_line_string; | |
| function createVertex(parentId, coordinates, path, selected) { | |
| return { | |
| type: 'Feature', | |
| properties: { | |
| meta: 'vertex', | |
| parent: parentId, | |
| coord_path: path, | |
| active: (selected) ? 'true' : 'false', | |
| }, | |
| geometry: { | |
| type: 'Point', | |
| coordinates, | |
| }, | |
| }; | |
| } | |
| // create a circle-like polygon given a center point and radius | |
| // https://stackoverflow.com/questions/37599561/drawing-a-circle-with-the-radius-in-miles-meters-with-mapbox-gl-js/39006388#39006388 | |
| function createGeoJSONCircle(center, radiusInKm, parentId, points = 64) { | |
| const coords = { | |
| latitude: center[1], | |
| longitude: center[0], | |
| }; | |
| const km = radiusInKm; | |
| const ret = []; | |
| const distanceX = km / (111.320 * Math.cos((coords.latitude * Math.PI) / 180)); | |
| const distanceY = km / 110.574; | |
| let theta; | |
| let x; | |
| let y; | |
| for (let i = 0; i < points; i += 1) { | |
| theta = (i / points) * (2 * Math.PI); | |
| x = distanceX * Math.cos(theta); | |
| y = distanceY * Math.sin(theta); | |
| ret.push([coords.longitude + x, coords.latitude + y]); | |
| } | |
| ret.push(ret[0]); | |
| return { | |
| type: 'Feature', | |
| geometry: { | |
| type: 'Polygon', | |
| coordinates: [ret], | |
| }, | |
| properties: { | |
| parent: parentId, | |
| }, | |
| }; | |
| } | |
| function getDisplayMeasurements(feature) { | |
| // should log both metric and standard display strings for the current drawn feature | |
| // metric calculation | |
| const drawnLength = (lineDistance(feature) * 1000); // meters | |
| let metricUnits = 'm'; | |
| let metricFormat = '0,0'; | |
| let metricMeasurement; | |
| let standardUnits = 'feet'; | |
| let standardFormat = '0,0'; | |
| let standardMeasurement; | |
| metricMeasurement = drawnLength; | |
| if (drawnLength >= 1000) { // if over 1000 meters, upgrade metric | |
| metricMeasurement = drawnLength / 1000; | |
| metricUnits = 'km'; | |
| metricFormat = '0.00'; | |
| } | |
| standardMeasurement = drawnLength * 3.28084; | |
| if (standardMeasurement >= 5280) { // if over 5280 feet, upgrade standard | |
| standardMeasurement /= 5280; | |
| standardUnits = 'mi'; | |
| standardFormat = '0.00'; | |
| } | |
| const displayMeasurements = { | |
| metric: `${numeral(metricMeasurement).format(metricFormat)} ${metricUnits}`, | |
| standard: `${numeral(standardMeasurement).format(standardFormat)} ${standardUnits}`, | |
| }; | |
| return displayMeasurements; | |
| } | |
| const doubleClickZoom = { | |
| enable: (ctx) => { | |
| setTimeout(() => { | |
| // First check we've got a map and some context. | |
| if (!ctx.map || !ctx.map.doubleClickZoom || !ctx._ctx || !ctx._ctx.store || !ctx._ctx.store.getInitialConfigValue) return; | |
| // Now check initial state wasn't false (we leave it disabled if so) | |
| if (!ctx._ctx.store.getInitialConfigValue('doubleClickZoom')) return; | |
| ctx.map.doubleClickZoom.enable(); | |
| }, 0); | |
| }, | |
| }; | |
| RadiusMode.clickAnywhere = function(state, e) { | |
| // this ends the drawing after the user creates a second point, triggering this.onStop | |
| if (state.currentVertexPosition === 1) { | |
| state.line.addCoordinate(0, e.lngLat.lng, e.lngLat.lat); | |
| return this.changeMode('simple_select', { featureIds: [state.line.id] }); | |
| } | |
| this.updateUIClasses({ mouse: 'add' }); | |
| state.line.updateCoordinate(state.currentVertexPosition, e.lngLat.lng, e.lngLat.lat); | |
| if (state.direction === 'forward') { | |
| state.currentVertexPosition += 1; // eslint-disable-line | |
| state.line.updateCoordinate(state.currentVertexPosition, e.lngLat.lng, e.lngLat.lat); | |
| } else { | |
| state.line.addCoordinate(0, e.lngLat.lng, e.lngLat.lat); | |
| } | |
| return null; | |
| }; | |
| // creates the final geojson point feature with a radius property | |
| // triggers draw.create | |
| RadiusMode.onStop = function(state) { | |
| doubleClickZoom.enable(this); | |
| this.activateUIButton(); | |
| // check to see if we've deleted this feature | |
| if (this.getFeature(state.line.id) === undefined) return; | |
| // remove last added coordinate | |
| state.line.removeCoordinate('0'); | |
| if (state.line.isValid()) { | |
| const lineGeoJson = state.line.toGeoJSON(); | |
| // reconfigure the geojson line into a geojson point with a radius property | |
| const pointWithRadius = { | |
| type: 'Feature', | |
| geometry: { | |
| type: 'Point', | |
| coordinates: lineGeoJson.geometry.coordinates[0], | |
| }, | |
| properties: { | |
| radius: (lineDistance(lineGeoJson) * 1000).toFixed(1), | |
| }, | |
| }; | |
| this.map.fire('draw.create', { | |
| features: [pointWithRadius], | |
| }); | |
| } else { | |
| this.deleteFeature([state.line.id], { silent: true }); | |
| this.changeMode('simple_select', {}, { silent: true }); | |
| } | |
| }; | |
| RadiusMode.toDisplayFeatures = function(state, geojson, display) { | |
| const isActiveLine = geojson.properties.id === state.line.id; | |
| geojson.properties.active = (isActiveLine) ? 'true' : 'false'; | |
| if (!isActiveLine) return display(geojson); | |
| // Only render the line if it has at least one real coordinate | |
| if (geojson.geometry.coordinates.length < 2) return null; | |
| geojson.properties.meta = 'feature'; | |
| // displays center vertex as a point feature | |
| display(createVertex( | |
| state.line.id, | |
| geojson.geometry.coordinates[state.direction === 'forward' ? geojson.geometry.coordinates.length - 2 : 1], | |
| `${state.direction === 'forward' ? geojson.geometry.coordinates.length - 2 : 1}`, | |
| false, | |
| )); | |
| // displays the line as it is drawn | |
| display(geojson); | |
| const displayMeasurements = getDisplayMeasurements(geojson); | |
| // create custom feature for the current pointer position | |
| const currentVertex = { | |
| type: 'Feature', | |
| properties: { | |
| meta: 'currentPosition', | |
| radiusMetric: displayMeasurements.metric, | |
| radiusStandard: displayMeasurements.standard, | |
| parent: state.line.id, | |
| }, | |
| geometry: { | |
| type: 'Point', | |
| coordinates: geojson.geometry.coordinates[1], | |
| }, | |
| }; | |
| display(currentVertex); | |
| // create custom feature for radius circlemarker | |
| const center = geojson.geometry.coordinates[0]; | |
| const radiusInKm = lineDistance(geojson, 'kilometers'); | |
| const circleFeature = createGeoJSONCircle(center, radiusInKm, state.line.id); | |
| circleFeature.properties.meta = 'radius'; | |
| display(circleFeature); | |
| return null; | |
| }; | |
| export default RadiusMode; |

@fc I find a problem,and I can't resolve the problem。Do you know the reason?what info do you need?

@zhaozhe0831 Is it a specific problem with the code I posted? I have just re-tested it and it locally and it seems fine. While it certainly needs work to achieve what you're looking for I'm not supporting it at all.
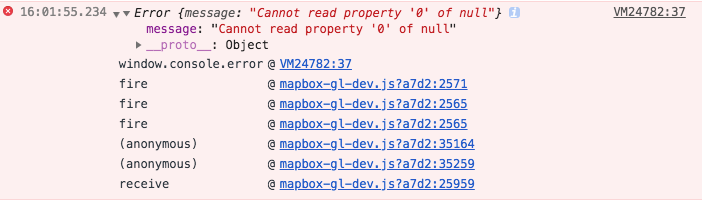
As to your error:
An error of "Cannot read property of null" likely means you have a variable that is null but the code is expecting the variable to be an array and it errors out when it sees it is null.
Below is how I was initializing it which is maybe helpful for someone although unlikely to be related to your error.
import React, { Component } from "react";
import "./App.css";
import ReactMapboxGl, { ZoomControl } from "react-mapbox-gl";
import MapboxDraw from "@mapbox/mapbox-gl-draw";
import "mapbox-gl/dist/mapbox-gl.css";
import "@mapbox/mapbox-gl-draw/dist/mapbox-gl-draw.css";
import RadiusMode from "./RadiusMode";

const Mapbox = ReactMapboxGl({
  accessToken:
    "add_your_token"
});

const mapboxProps = {
  style: "mapbox://styles/your_styles_goes_here",
  zoom: [8],
  containerStyle: {
    height: "100vh ",
    width: "100vw"
  }
};

const draw = new MapboxDraw({
  defaultMode: "draw_circle",
  modes: {
    ...MapboxDraw.modes,
    draw_circle: RadiusMode
  },
  userProperties: true,
  displayControlsDefault: false
});
draw.modes.DRAW_CIRCLE = "draw_circle";

class App extends Component {
  handleMapLoaded = map => {
    map.addControl(draw);
    map.fitBounds([
      [-0.12646452955218024, 51.47684019822054],
      [-0.07084624343019641, 51.50398878236996]
    ]);
  };
  render() {
    return (
      <div className="App">
        <Mapbox {...mapboxProps} onStyleLoad={this.handleMapLoaded}>
          <ZoomControl position="top-left" />
        </Mapbox>
      </div>
    );
  }
}

export default App;
@fc I use vue & iview. This is my code. I still meet the error. I have try my best, but I don't resolve the problem. I think my code is correct. But it has bug.
I create a repository. https://github.com/zhaozhe0831/mapbox-draw-demo. This is my code. Thank you for your help.
{
  "name": "mapbox-demo",
  "version": "0.1.0",
  "private": true,
  "scripts": {
    "serve": "vue-cli-service serve",
    "build": "vue-cli-service build",
    "lint": "vue-cli-service lint"
  },
  "dependencies": {
    "@mapbox/mapbox-gl-draw": "^1.0.9",
    "@turf/bbox-polygon": "^6.0.1",
    "@turf/length": "^6.0.2",
    "@turf/turf": "^5.1.6",
    "iview": "^3.1.2",
    "mapbox-gl": "^0.49.0",
    "numeral": "^2.0.6",
    "vue": "^2.5.16",
    "vue-router": "^3.0.1",
    "lodash": "^4.17.11",
    "vuex": "^3.0.1"
  },
  "devDependencies": {
    "@vue/cli-plugin-babel": "^3.0.0-rc.10",
    "@vue/cli-plugin-eslint": "^3.0.0-rc.10",
    "@vue/cli-service": "^3.0.0-rc.10",
    "@vue/eslint-config-airbnb": "^3.0.4",
    "lint-staged": "^7.3.0",
    "node-sass": "^4.9.3",
    "sass-loader": "^7.1.0",
    "vue-template-compiler": "^2.5.16"
  },
  "gitHooks": {
    "pre-commit": "lint-staged"
  },
  "lint-staged": {
    "*.js": [
      "vue-cli-service lint",
      "git add"
    ],
    "*.vue": [
      "vue-cli-service lint",
      "git add"
    ]
  }
}<template>
<Layout class="layout"
width="300">
<Sider class="layout__sider"
width="300">
<Tooltip content="绘制圆"
style="width:100%;">
<i-button type="primary"
size="small"
long
@click="switchMapDrawType('circle')">
circle
</i-button>
</Tooltip>
</Sider>
<Content class="layout__content">
<section id="map"></section>
</Content>
</Layout>
</template>import mapboxgl from 'mapbox-gl';
import MapboxDraw from '@mapbox/mapbox-gl-draw';
import 'mapbox-gl/dist/mapbox-gl.css';
import '@mapbox/mapbox-gl-draw/dist/mapbox-gl-draw.css';
import radiusMode from './assets/draw-mode-radius';
import _mapDrawOption from './assets/map-draw-opt.json';
mapboxgl.accessToken = 'token';
const map = {
instance: null,
draw: null
};
export default {
name: 'report-create',
mounted() {
this.initMap();
},
methods: {
// 初始化地图
initMap() {
const option = {
container: 'map', // container id
center: [116.395645, 39.929986], // starting position
style: 'mapbox://styles/mapbox/dark-v9',
hash: false,
zoom: 11,
minZoom: 10,
maxZoom: 20,
pitchWithRotate: false
};
map.instance = new mapboxgl.Map(option);
map.draw = new MapboxDraw({
styles: _mapDrawOption,
modes: {
...MapboxDraw.modes,
draw_circle: radiusMode // eslint-disable-line camelcase
},
displayControlsDefault: false
});
map.instance.addControl(map.draw);
},
// 切换手绘类型
switchMapDrawType() {
map.draw.changeMode('draw_circle');
}
}
};.layout {
position: relative;
overflow: hidden;
height: 100vh;
background-color: #f5f7f9;
&__sider {
position: relative;
padding: 20px;
background-color: #fff;
}
&__content {
position: relative;
height: 100%;
}
}
#map {
width: 100%;
height: 100%;
background: #f5f7f9;
:focus {
outline: 0;
}
}
.sider {
&__footer {
position: absolute;
right: 16px;
bottom: 16px;
left: 16px;
}
}
.panel {
&__footer {
position: absolute;
right: 16px;
bottom: 16px;
}
}Anyone know how to make the distance measurement (currentVertex) persist after the draw is finished? It always disappears once you complete the radius.
Hey! 👋
Once I start drawing, I get some error every time I move the mouse
I added the active: 'true' thing and renamed the @turf/line-distance to @turf/length so that it doesn't crash. (I also needed to change the import mapbox-gl-draw to @mapbox/mapbox-gl-draw so that it finds the module)
Could anyone help me with it? Thanks in advance! ❤️
Uncaught TypeError: Cannot read property 'r' of null
    at Zn (blob:http://localhost:3000/759ff3fc-9053-4c77-9822-ace289fec8aa:7241)
    at Hn.populatePaintArray (blob:http://localhost:3000/759ff3fc-9053-4c77-9822-ace289fec8aa:7278)
    at Gn.populatePaintArrays (blob:http://localhost:3000/759ff3fc-9053-4c77-9822-ace289fec8aa:7390)
    at Kn.populatePaintArrays (blob:http://localhost:3000/759ff3fc-9053-4c77-9822-ace289fec8aa:7488)
    at Pa.addFeature (blob:http://localhost:3000/759ff3fc-9053-4c77-9822-ace289fec8aa:8551)
    at Pa.populate (blob:http://localhost:3000/759ff3fc-9053-4c77-9822-ace289fec8aa:8508)
    at P.parse (blob:http://localhost:3000/759ff3fc-9053-4c77-9822-ace289fec8aa:12570)
    at blob:http://localhost:3000/759ff3fc-9053-4c77-9822-ace289fec8aa:12687
    at r.Ue [as loadVectorData] (blob:http://localhost:3000/759ff3fc-9053-4c77-9822-ace289fec8aa:13585)
    at r.L.loadTile (blob:http://localhost:3000/759ff3fc-9053-4c77-9822-ace289fec8aa:12675)
Some alternatives for those stopping by to read this.
If you really and truly need circle support, you may want to consider using Leaflet.draw instead:
https://github.com/Leaflet/Leaflet.draw
It's possible that it could be combined with mapbox-gl-leaflet so you can keep mapbox-gl under the hood (untested).
https://github.com/mapbox/mapbox-gl-leaflet/issues
Or, I believe you could use mapbox.js with Leaflet.draw too (also, untested):
https://www.mapbox.com/mapbox.js/api/v3.1.1/
Now I haven't tried the above (yet) but you'll have to weigh the pros/cons to see if this is an approach that could work for you and your project.
Using the code that @fc posted on 12 Sep, I also get the "Cannot read property '0' of null" error message. I've found a workaround - in the RadiusMode.onSetup function, just initialise the circle polygon's coordinates with a non-empty array:
    geometry: {
      type: "Polygon",
      coordinates: [[0,0]]
    }
I guess the real underlying problem is elsewhere, but this at least stops the error message appearing.
@fc do you happen to have a working example of mapbox-gl-circle edition of this? The draw controls is not showing a button for drawing a circle and if I set draw_line_string to CircleMode it still doesn't draw a circle.
ufff,
there is no documentation of all those function toDisplayFeatures, clickAnywhere, state: active.
Notice if you move the circle around it changes to oval (ellipse), depends upon the radius if u draw a large circle around north pole, and then move around it changes to oval
I've published an npm module called mapbox-gl-draw-circle which lets you draw and edit a circle. Please do take a look and feel free to reach out to me if you find any issues.
I've published an npm module called mapbox-gl-draw-circle which lets you draw and edit a circle. Please do take a look and feel free to reach out to me if you find any issues.
Project has been dropped, not updated in 4 years :(
@fc Thank you for your advice.