Created
January 10, 2015 04:59
-
-
Save craffel/2d727968c3aaebd10359 to your computer and use it in GitHub Desktop.
Draw a neural network diagram with matplotlib!
This file contains bidirectional Unicode text that may be interpreted or compiled differently than what appears below. To review, open the file in an editor that reveals hidden Unicode characters.
Learn more about bidirectional Unicode characters
| import matplotlib.pyplot as plt | |
| def draw_neural_net(ax, left, right, bottom, top, layer_sizes): | |
| ''' | |
| Draw a neural network cartoon using matplotilb. | |
| :usage: | |
| >>> fig = plt.figure(figsize=(12, 12)) | |
| >>> draw_neural_net(fig.gca(), .1, .9, .1, .9, [4, 7, 2]) | |
| :parameters: | |
| - ax : matplotlib.axes.AxesSubplot | |
| The axes on which to plot the cartoon (get e.g. by plt.gca()) | |
| - left : float | |
| The center of the leftmost node(s) will be placed here | |
| - right : float | |
| The center of the rightmost node(s) will be placed here | |
| - bottom : float | |
| The center of the bottommost node(s) will be placed here | |
| - top : float | |
| The center of the topmost node(s) will be placed here | |
| - layer_sizes : list of int | |
| List of layer sizes, including input and output dimensionality | |
| ''' | |
| n_layers = len(layer_sizes) | |
| v_spacing = (top - bottom)/float(max(layer_sizes)) | |
| h_spacing = (right - left)/float(len(layer_sizes) - 1) | |
| # Nodes | |
| for n, layer_size in enumerate(layer_sizes): | |
| layer_top = v_spacing*(layer_size - 1)/2. + (top + bottom)/2. | |
| for m in xrange(layer_size): | |
| circle = plt.Circle((n*h_spacing + left, layer_top - m*v_spacing), v_spacing/4., | |
| color='w', ec='k', zorder=4) | |
| ax.add_artist(circle) | |
| # Edges | |
| for n, (layer_size_a, layer_size_b) in enumerate(zip(layer_sizes[:-1], layer_sizes[1:])): | |
| layer_top_a = v_spacing*(layer_size_a - 1)/2. + (top + bottom)/2. | |
| layer_top_b = v_spacing*(layer_size_b - 1)/2. + (top + bottom)/2. | |
| for m in xrange(layer_size_a): | |
| for o in xrange(layer_size_b): | |
| line = plt.Line2D([n*h_spacing + left, (n + 1)*h_spacing + left], | |
| [layer_top_a - m*v_spacing, layer_top_b - o*v_spacing], c='k') | |
| ax.add_artist(line) |
Thank you for the code, saved me a lot of time drawing it myself.
How can i have labels for coefficients and intercepts. I need for demonstration.
Labels(a1,b1,c1,d1 ) etc.. like this
@craffel Thanks for the wonderful code. However, the layers get added from top to bottom, not from left to right. This makes me find difficulties in putting separate colors for the nodes in the input, hidden layer, and output! Could that be done? Also, some annotations for the layers?
Sign up for free
to join this conversation on GitHub.
Already have an account?
Sign in to comment
I was able to successfully run @ljhuang2017 code and posted on a new gist
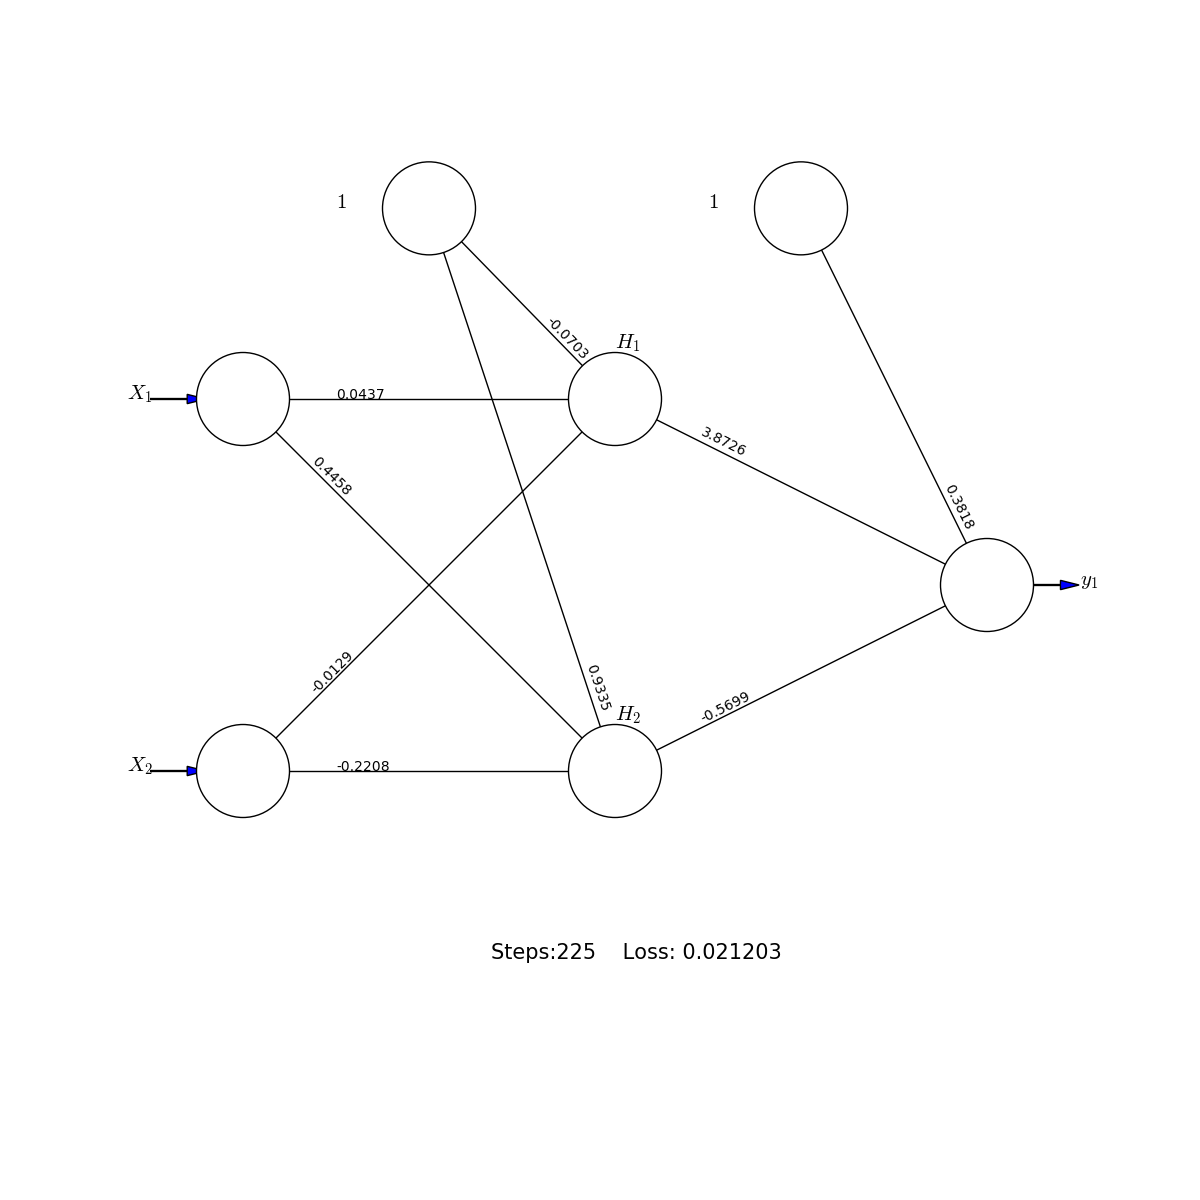
The final result looks like this: