Keywords: wind power, Germany, Bayern, globalwindatlas, GWA
Purpose: I'm trying to show my neighbors around Munich that windfarms make more sense where there's more wind. To this end, here's a map of GWA windspeeds at 150m, together with the sites of 202 windfarms in Bayern:
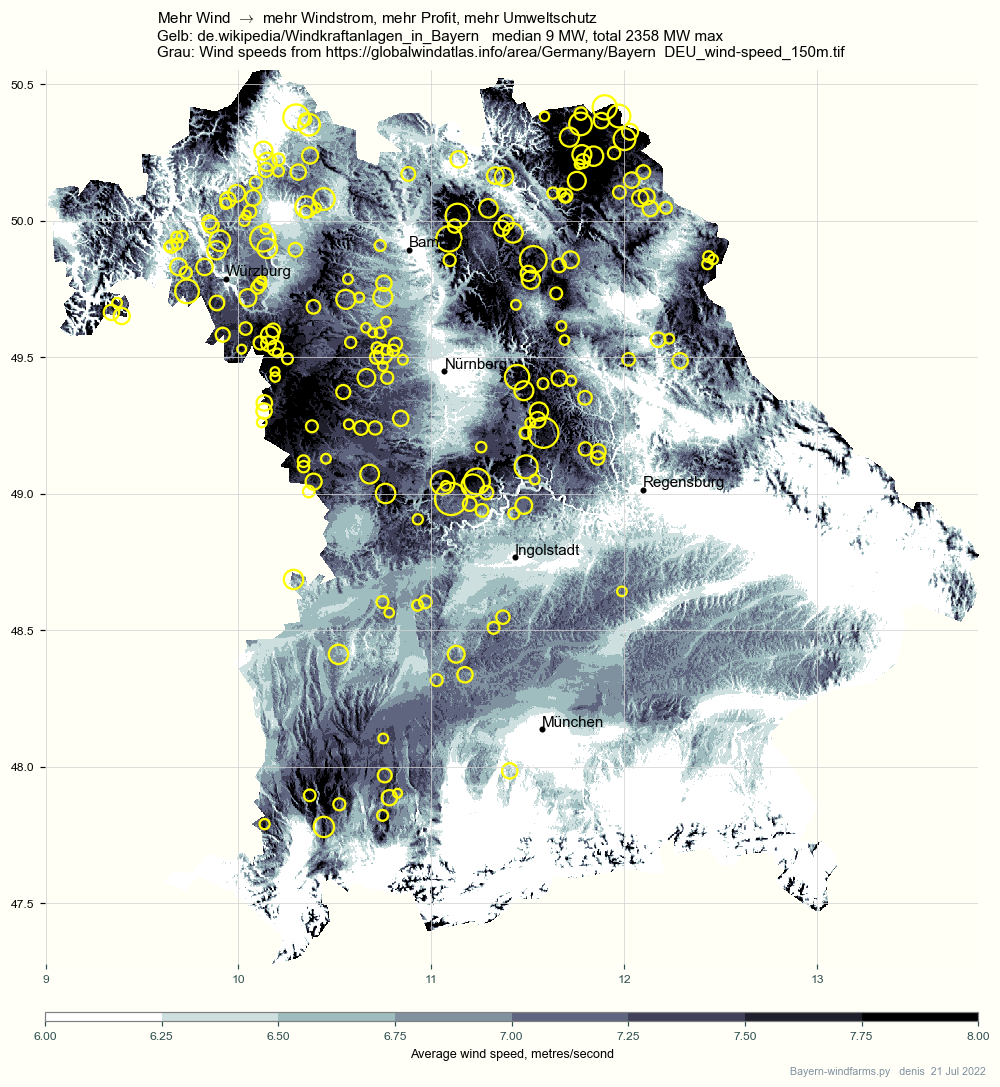
Both maps tell roughly the same story, in different ways:
- the wind blows much more strongly in north Bayern than in flat south Bayern
- wind farm owners vote with their feet to build where there's more wind.
There are of course many factors in €€€€ decisions:
politics
costs, profits
alternatives: onshore, offshore, photovoltaic, coal, gas, nuclear power
power storage capacity
Likes
politics.
As much as engineers and professors wish for "rational" decision-making, transparent and understandable, windfarm owners and politicians have their own agendas. I'd welcome regional planning of windfarms, with estimated costs and profits -- data on the table. Does anyone know of such planning, anywhere in Europe ?
Ballpark estimates of
Costs: $1.3M per MW installed (i.e. max) + land + building costs + financing.
Profits: subvention 3.7 cents per kWh = €37 x 24 x 365 = €324,120 per year,
+ the market price of electricity.
For this purpose, maps to give laypersons an overview, we don't need great accuracy. MacKay:
This rough answer is not exact, but it's accurate enough to inform interesting conversations.
I like to have a rough idea about data -- what's measured, what's extrapolated -- and I like spot checks. For GWA I see neither. GWA windspeeds at 50m and 150m in https://globalwindatlas.info for Bayern appear to be simply scaled from 100m. Here are least-squares fits of log 50m and log 150m to log wind100 with statsmodels OLS, at the sites of 202 windfarms in Bayern (importance weighting):
-- tifs_near 202 points in DE-BY  quantiles [10 25 50 75 90]
DEU_wind-speed_100m.tif	 [5.3 5.6 6.1 6.5 6.9]
DEU_wind-speed_50m.tif	 [4.3 4.6 5 5.4 5.8]
DEU_wind-speed_150m.tif	 [6.3 6.6 7.1 7.4 7.8]
DEU_capacity-factor_IEC3.tif [0.26 0.3  0.34  0.38 0.42] ❓

-- fit log Y ~ p log X = DEU_wind-speed_100m.tif
DEU_wind-speed_50m.tif       ~ X ^ (0.894 +- 0.0001)  R2 100 %
DEU_wind-speed_150m.tif      ~ X ^ (1.08 +- 9e-05)  R2 100 %
DEU_capacity-factor_IEC3.tif ~ X ^ (-0.604 +- 0.0007)  R2 95 %
MW for wind turbines, like KW for cars, is a maximum, peak value. This maximum is called "rated" or "installed" power. On average over a year, a "4 MW max" wind turbine might generate 25 % of max. This ratio, called the "load factor" or "capacity factor", depends on turbine type, wind, and terrain, in complex ways.
In God we trust, all others bring data.
GWA's capacity factor, median 34 %, looks way high. For comparison, in Bayern,
79.4 TWh Strom in Bayern in 2019 (Süddeutsche Zeitung 19/20 Juni 2021)
* 6.7 % Windenergie = 5.3 TWh (by the way, 51.3 % renewables)
/ 8678 = 613 MW
/ 2584 MW installed
———————
= 23.7 %.
What matters is electricity actually generated (and used). A 90 % accurate model of wind followed by a 50 % accurate model of wind ⟶ electricity gives us ...
The standard model is: power ~ ρ A v³ / 2, where v is windspeed
(MacKay page 263).
Then 1/4 more wind would give us almost 2 x as much power (1.25^3 = 1.95),
2 x profit, 2 x better for the environment -- great.
But does power ~ v³ hold for real wind turbines under real conditions, even roughly ?
To test any model we need data of windspeeds
and electricity actually generated;
but such data is worth €€€, so exceedingly rare.
Windspeed ⟶ windfarm power is only part of the story: of __ MWh generated at a windfarm today, how much is used today, how much put in pump storage for tomorrow, how much thrown away ? In Germany, thrown-away power, "Geisterstrom" (phantom power) is paid for anyway, to the tune of €761,000,000 in 2020. (As far as I know, this is now (EEG-2022) paid by the taxpayer, not by the consumer; comments welcome.)
https://globalwindatlas.info/area/Germany/Bayern -- zoom in to 6 - 9 m/s
https://de.wikipedia.org/wiki/Liste_von_Windkraftanlagen_in_Bayern
https://de.wikipedia.org/wiki/Erneuerbare-Energien-Gesetz (much of this is old)
https://weatherguardwind.com/how-much-does-wind-turbine-cost-worth-it (US)
MacKay,
Sustainable Energy -- without the Hot Air
368 pages; send the cartoon on p. 18 around.
Comments welcome
cheers
-- denis