| title | published | description | tags | cover_image |
|---|---|---|---|---|
Inspecting .NET application state with SOS |
false |
Learn how to use the Windows Debugger to inspect application state from a .NET process dump |
.net, windbg, csharp, debugging |
In this post, we'll cover how to use the SOS debugging tools to inspect variables from a process dump of a .NET Framework / .NET Core application.
Required:
In this first example, we'll use a running ASP.NET MVC 5 application hosted by IIS, but the steps here can be used on a normal .NET framework Windows application. Let's start by taking a full memory dump of a running application.
Download ProcDump and copy it to the server that runs the application you want to debug. Obtain the process ID from the application you want to profile by using Task Manager, and then pass it as an argument to procdump.
procdump -ma <pid>
You should now have a dump named similar to w3wp_171229_151050.dmp in the working directory.
Note:
If you're running several applications under a single app pool in IIS, it may be easier to debug by changing the app to run under its own application pool, which allows the ASP.NET app to run under a dedicated process.
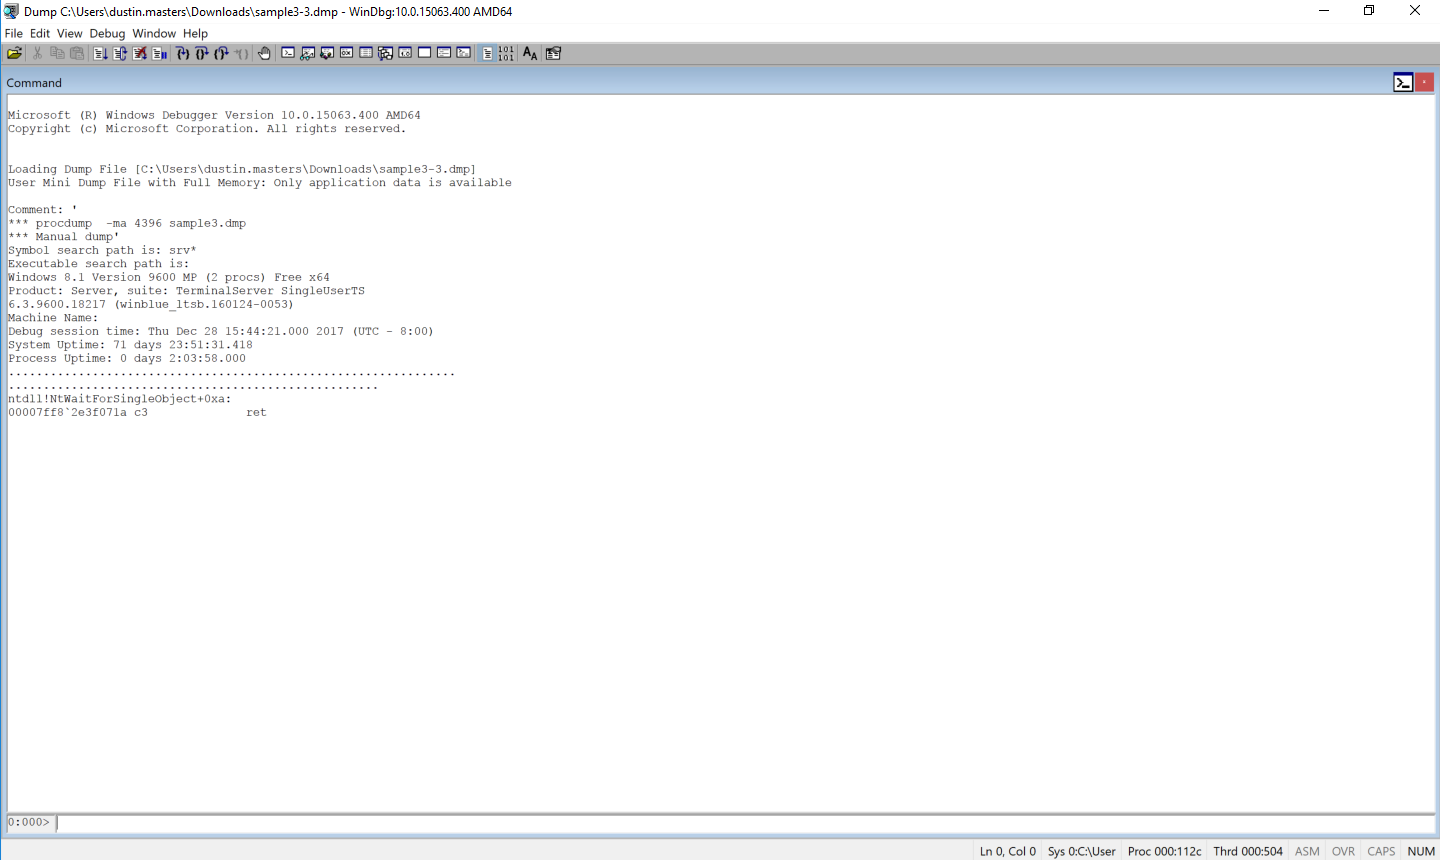
Now that we have a memory dump, it's time to look at the suspended state of the application. Copy the dump file to your workstation, and then open it via File > Open Crash Dump in WinDBG. Your screen should look like this:
Load the SOS debugging extension, which will allow us to inspect the managed threads:
!loadby sos clr
Then, list the stack trace of every thread:
!eestack
Note:
If get an exception when running this command and you are using IIS Express, try the command again. There appears to be a bug that throws an exception only for the first command run from WinDbg, which should not affect the rest of your debugging session.
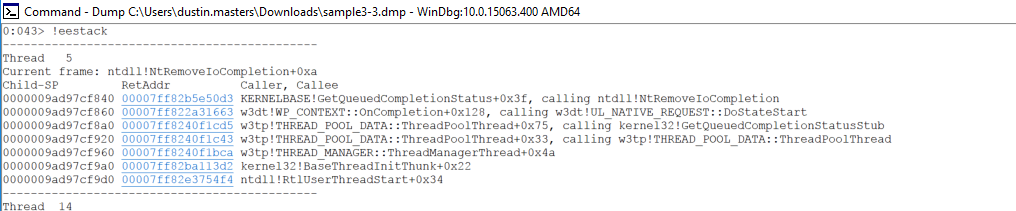
You should see a lot of threads in the output. To narrow the results down, search for the namespace of your project in the output text.
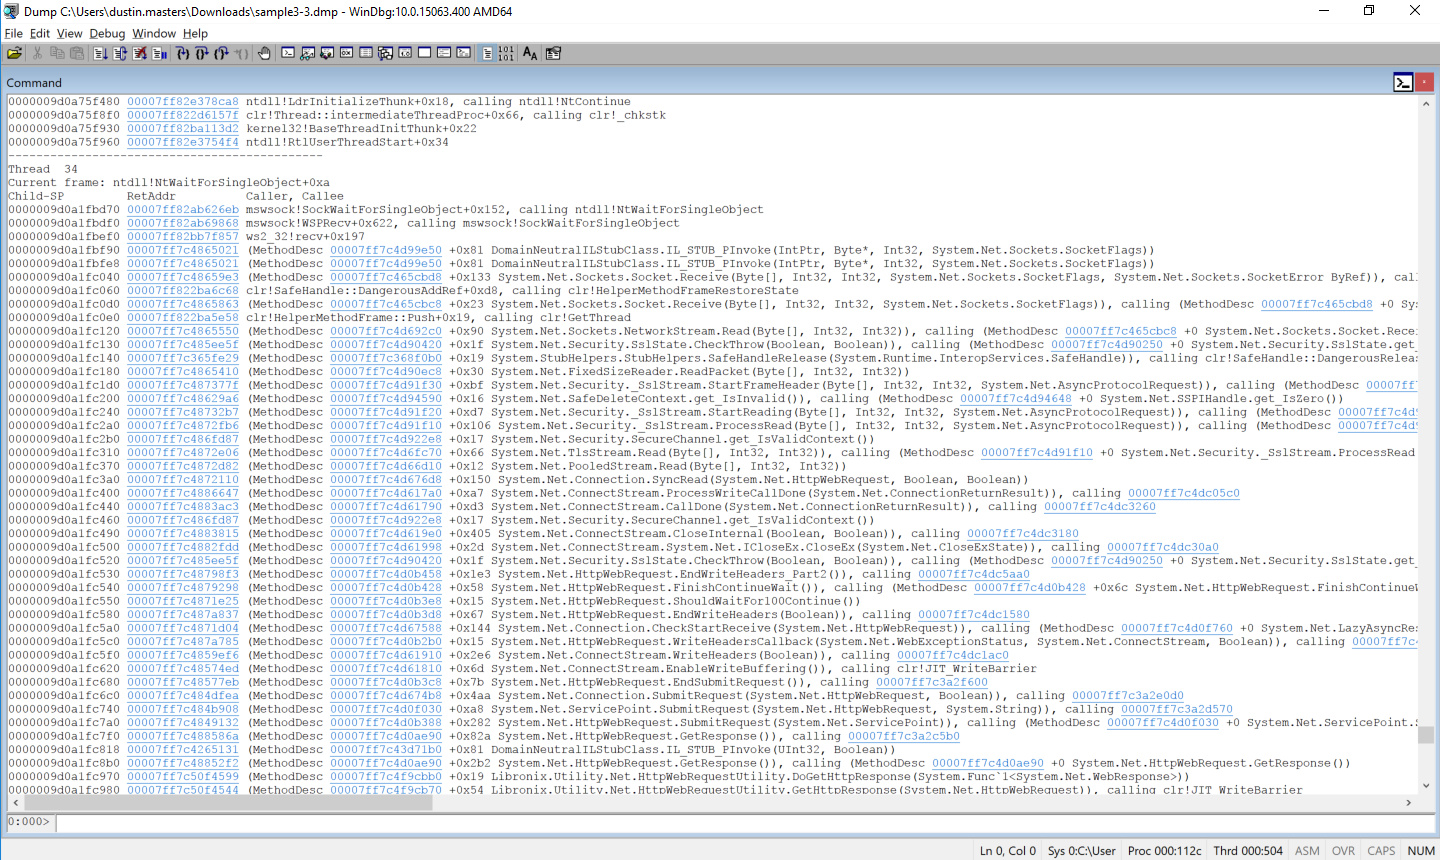
We can see that there is an external web request being made in Thread 34. Let's look at what external URL is being requested. Switch to the thread, and then run clrstack -p to get some more detailed information about each method call.
~34 s
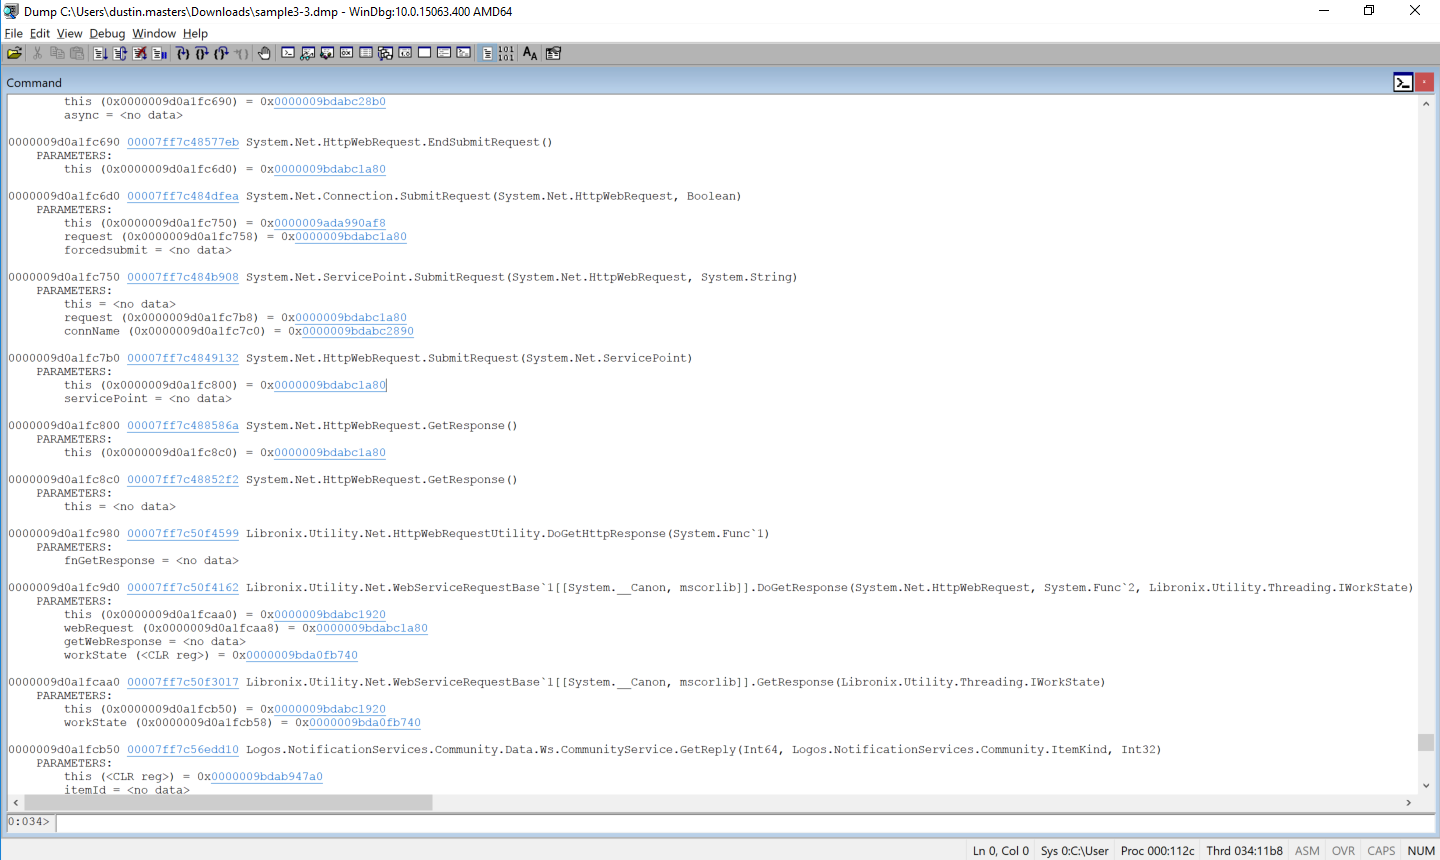
!clrstack -p
Note:
You may see many arguments that contain the value
<no data>. This can be caused by compiler optimizations; inspecting the state of these parameters is beyond the scope of this article.
The controller is present in this call stack, so let's inspect the object instance by clicking on the this instance address, which is a shortcut for the !DumpObj command.
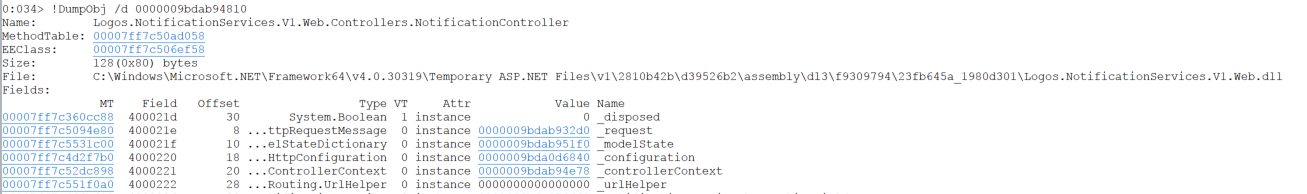
This instance contains a field named _request, which contained a field named requestUri, which has the original URI for this request:
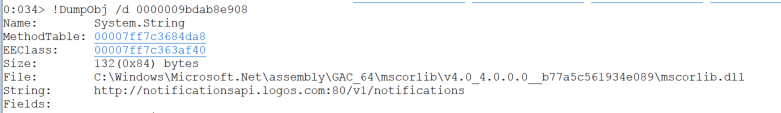
That's it! The commands vary slightly for dumping different field types.
Required:
- LLDB 3.9
- Locally-built copy of the SOS plugin in the CoreCLR repo - instructions
In this next scenario, we'll look at inspecting a core dump from a .NET Core app running on an Ubuntu x64 instance. The instance will have a core dump taken while a request is processing, which we will then inspect.
Take a core dump of the process using the createdump utility. These commands assume you have the coreclr repo checked out to ~/git/coreclr, and that you're running an application built with .NET Core 2.0.
sudo ~/git/coreclr/bin/Product/Linux.x64.Debug/createdump -u (pid)
Load the dump in LLDB. This command also loads the SOS debugging extension.
lldb-3.9 dotnet -c /tmp/coredump.18842 -o "plugin load ~/git/coreclr/bin/Product/Linux.x64.Debug/libsosplugin.so"
After a few moments, a CLI will become available. Run eestack to dump the state of all CLR threads. If you get an empty output or a segmentation fault, verify that you are running the correct version of lldb and are loading libsosplugin from the bin directory, and that you have created the core dump with createdump.
eestack
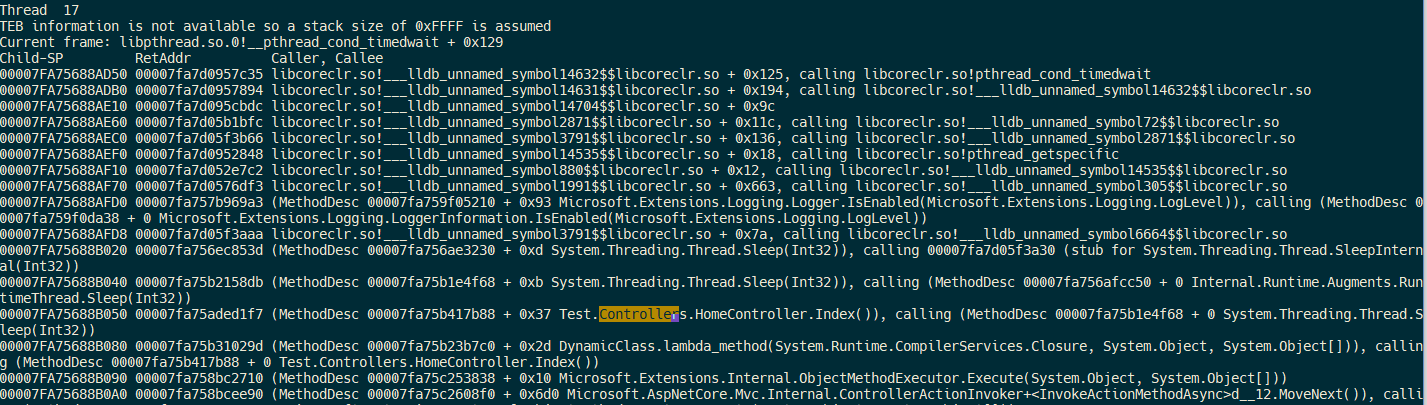
There is an instance of HomeController in the stack of Thread 17. Switch to it to reveal more information about the current request. This time, we'll inspect the state of an internal .NET Core request frame, since information about the current request isn't as accessible as it was in ASP.NET MVC 5.
thread select 17
sos DumpStackObjects
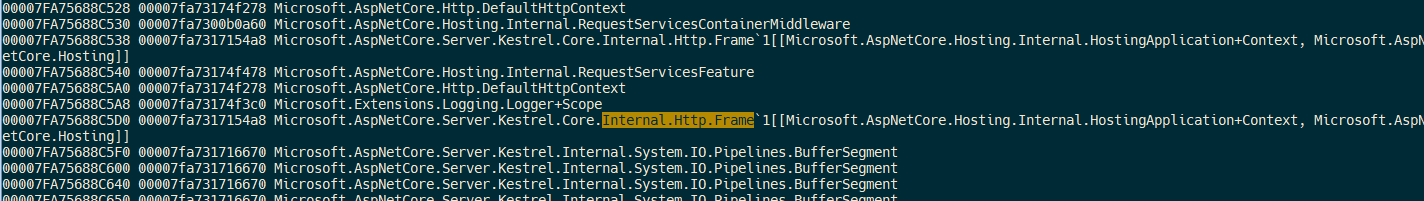
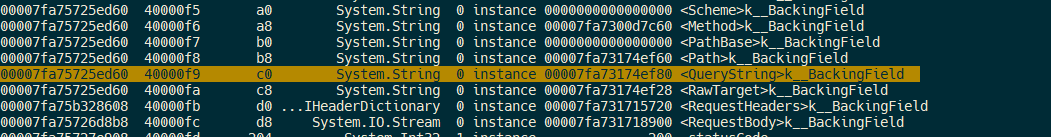
Look for the address of Microsoft.AspNetCore.Server.Kestrel.Core.Internal.Http.Frame'1[[Microsoft.AspNetCore.Hosting.Internal.HostingApplication+Context, Microsoft.AspNetCore.Hosting]] in the output, and then dump the object. The name of this class might differ slightly based on the version of the framework you're running.
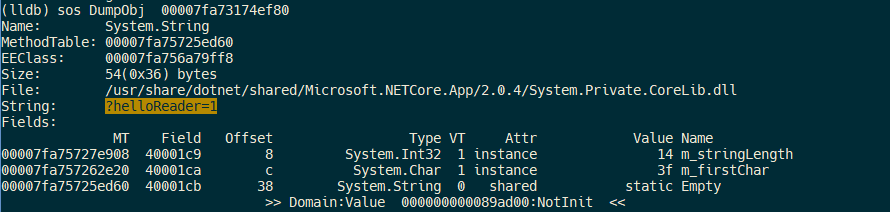
Identify the QueryString field address:
Dumping that field reveals the query part of the URL the browser requested!
Thanks for reading. If debugging problems like this sounds interesting to you, join us!
Further reading:
- SOS.dll (SOS Debugging Extension)
- .NET Core Debugging Instructions
- Building CoreCLR on OS X
- Building LLDB - Required for debugging .NET Core on OS X
- .NET Core MiniDump Format