Last active
February 25, 2024 18:20
Plotting a cool Rotatable 3D Bathymetric + Elevation Cube Using rayshader and marmap
This file contains bidirectional Unicode text that may be interpreted or compiled differently than what appears below. To review, open the file in an editor that reveals hidden Unicode characters.
Learn more about bidirectional Unicode characters
| ## To install the latest version from Github: | |
| # install.packages("devtools") | |
| # devtools::install_github("tylermorganwall/rayshader") | |
| ## also marmap | |
| # install.packages("marmap") | |
| ## load these libraries (?) | |
| # library(rayshader) | |
| # library(marmap) | |
| ## now just imported... | |
| getBathyMatrix <- function( | |
| coords, | |
| # how many minutes between points? | |
| gridResolutionMinutes = 10, | |
| plot = FALSE | |
| ){ | |
| ################# | |
| # raster buffer? | |
| # | |
| # The radius of a buffer around each point from which to extract cell values. | |
| # If the distance between the sampling point and the center of a cell is less than or equal | |
| # to the buffer, the cell is included. The buffer can be specified as a single value, or as | |
| # a vector of the length of the number of points. | |
| # If the data are not projected (latitude/longitude), the unit should be meters. Otherwise it | |
| # should be in map-units (typically also meters). | |
| # | |
| rasterBuffer = gridResolutionMinutes * 30 | |
| # | |
| bathyData <- marmap::getNOAA.bathy( | |
| lon1 = coords[1], | |
| lon2 = coords[2], | |
| lat1 = coords[3], | |
| lat2 = coords[4], | |
| resolution = gridResolutionMinutes, | |
| antimeridian = FALSE) | |
| # now make it a raster | |
| rasterData<-marmap::as.raster(bathyData) | |
| if(plot){ | |
| graphics::plot.raster(rasterData) | |
| } | |
| matData <- matrix( | |
| raster::extract(rasterData, | |
| raster::extent(rasterData), | |
| buffer = rasterData), | |
| nrow=raster::ncol(rasterData), | |
| ncol=raster::nrow(rasterData)) | |
| return(matData) | |
| } | |
| plotBathyMatrix <- function(matData, | |
| gridResolutionMinutes, | |
| # vertical exaggeration | |
| # should the height be exaggerated or flattened? | |
| # if 1, no exaggeration | |
| # more than 1, tall things get taller, deep things deeper | |
| # less than 1, everything is flatter | |
| vertExagg = 1 | |
| ){ | |
| ########################## | |
| # zscaleGrid | |
| # Default '1'. The ratio between the x and y spacing (which are assumed to be equal) | |
| # and the z axis. For example, if the elevation levels are in units of 1 meter and the | |
| # grid values are separated by 10 meters, 'zscale' would be 10. Adjust the zscale down | |
| # to exaggerate elevation features. | |
| ######### | |
| # how many meters are in a minute? ~30 at the equator | |
| zscaleGridOrig <- gridResolutionMinutes * 30 | |
| zscaleGrid <- zscaleGridOrig / vertExagg | |
| ############# | |
| # get shadows and ambient lighting | |
| shadowRay <- rayshader::ray_shade(matData, | |
| zscale=zscaleGrid , lambert=FALSE) | |
| ambientRay = rayshader::ambient_shade(matData, | |
| zscale=zscaleGrid ) | |
| # add the effects | |
| objectRay <- rayshader::sphere_shade(matData, | |
| zscale=zscaleGrid , texture = "imhof1") | |
| objectRay <- rayshader::add_shadow(objectRay, shadowRay , 0.5) | |
| objectRay <- rayshader::add_shadow(objectRay, ambientRay) | |
| # now plot it | |
| while (rgl::rgl.cur() > 0) { | |
| rgl::rgl.close() | |
| } | |
| rayshader::plot_3d(objectRay , matData, | |
| zscale=zscaleGrid, fov=0, theta=-45, phi=45, | |
| windowsize=c(200,200, 500,400), zoom=0.75, | |
| water=TRUE, waterdepth = 0, | |
| wateralpha = 0.5, watercolor = "lightblue", | |
| waterlinecolor = "white", waterlinealpha = 0.5) | |
| } | |
| ################################# | |
| # Gulf of Alaska | |
| # something like | |
| # 63,-127 | |
| # 49,-165 | |
| # "+proj=longlat +datum=WGS84 +ellps=WGS84 +towgs84=0,0,0" | |
| # +proj=moll +lon_0=-140 | |
| minuteRes <- 1 | |
| matGoA <- getBathyMatrix( | |
| coords = c(-165, -123, 45, 64), | |
| # how many minutes between points? | |
| gridResolutionMinutes = minuteRes , | |
| plot = FALSE | |
| ) | |
| plotBathyMatrix(matData = matGoA, | |
| gridResolutionMinutes = minuteRes, | |
| vertExagg = 0.2) |
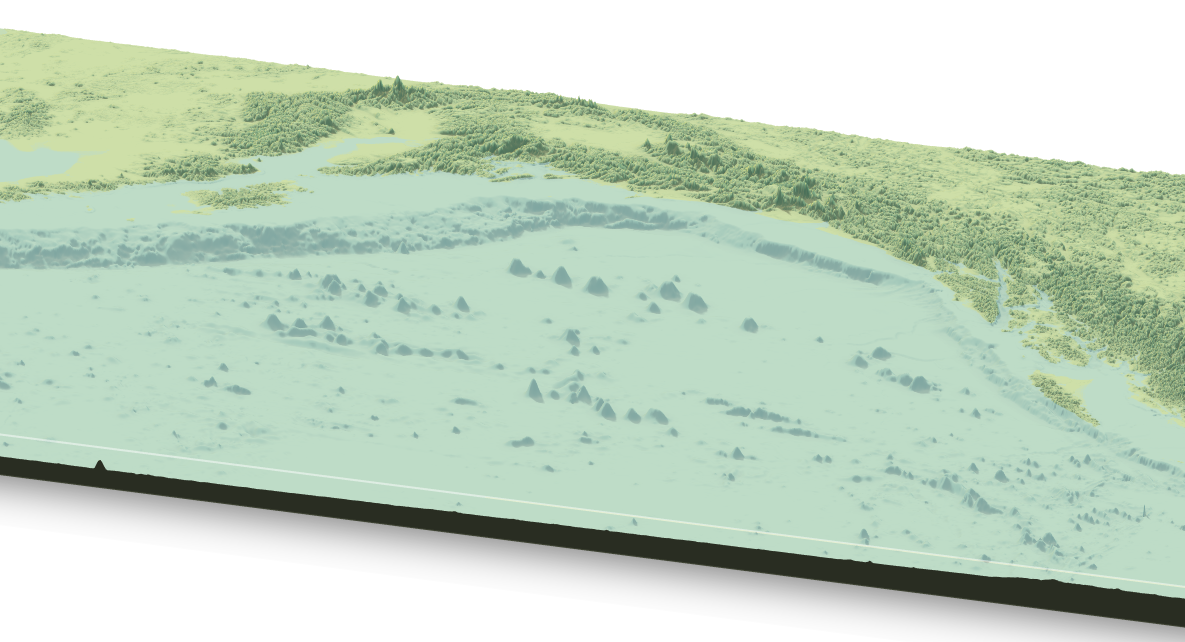
BEHOLD ALASKA
(as I described last night)
@willgearty @Leptaena @daveyfwright @laurasoul
Just change the coordinates and you can do anywhere as long as the USGS has the data in its API. Its pretty low resolution though...
Super cool, thanks for sharing!
Sign up for free
to join this conversation on GitHub.
Already have an account?
Sign in to comment
And a taste of what you get: