Skip to content

Instantly share code, notes, and snippets.

@hddananjaya
Last active June 2, 2020 11:40
Show Gist options
  • Save hddananjaya/5b9d567d00799e69552c53be82ced866 to your computer and use it in GitHub Desktop.
Save hddananjaya/5b9d567d00799e69552c53be82ced866 to your computer and use it in GitHub Desktop.
Postgres CITEXT vs TEXT performance
@hddananjaya
Copy link
Author

hddananjaya commented Mar 2, 2020

So you reached here and you already know that there is a performance issue with CITEXT in postgres! I had to measure it. So I simulated db insertion from the user's end by just automating a POST request using python. If you wanna convert your browser request to python request, go to network tab and copy as CURL, then convert CURL command to Python using https://curl.trillworks.com/.
I did and this was the result for inserting students to course, which is one of our features that we wanted to check.

citext-performance

This is the code that I used to automate requests.

import os
import random
import string
import requests
import time


def randomString(stringLength=10):
    """Generate a random string of fixed length """
    letters = string.ascii_lowercase
    return ''.join(random.choice(letters) for i in range(stringLength))


cookies = {
    'userSession': 'eyJhbGciOiJIUzI1NiIsInR5cCI6IkpXVCJ9.eyJkaWQiOiJ1bnZlcmlmaWVkLTY0NjkyZGMwLTVjMzgtMTFlYS1hZmM5LTc3YmM3OTdiYjZlMSIsInR5cGUiOjAsInVzZXJSb2xlIjoiaXNzdWVyIiwiY29udGFjdCI6MSwicGVybWlzc2lvbnMiOlsidGVhY2hlcjpyZWFkIiwidGVhY2hlcjp3cml0ZSIsInN0dWRlbnQ6cmVhZCIsInN0dWRlbnQ6d3JpdGUiLCJhZG1pbiJdLCJpYXQiOjE1ODMxMjA5NDAsImV4cCI6MTU4NDMzMDU0MH0.fIPtJNTWXEH2fUccrG0j4rEHcIrtsf37xrFTNzoTge8',
    'intercom-session-bv38u4jk': 'TENTVjY3ZGdyc2NGeGh6ZGdXYVBIbGhWMSt4UnFscTNlMEZlOXF0VFJJUGVWdTc1eWFGZ1Rpc2dveC83ZU1hSi0tNTc2eDdxc242TVI4eDMwS1pzVHlwZz09--d94ac3c104d258bba637685340857e19e82dafe6',
}

headers = {
    'Connection': 'keep-alive',
    'Accept': 'application/json, text/plain, */*',
    'Origin': 'http://localhost:3000',
    'Sec-Fetch-Dest': 'empty',
    'User-Agent': 'Mozilla/5.0 (Linux; Android 6.0; Nexus 5 Build/MRA58N) AppleWebKit/537.36 (KHTML, like Gecko) Chrome/80.0.3987.87 Mobile Safari/537.36',
    'Content-Type': 'application/json;charset=UTF-8',
    'Sec-Fetch-Site': 'same-site',
    'Sec-Fetch-Mode': 'cors',
    'Referer': 'http://localhost:3000/courses/d9eccc00-5c38-11ea-afc9-77bc797bb6e1',
    'Accept-Language': 'en-US,en;q=0.9',
}

std_count = 50
time_list = []
for i in range (20):
    invites = []
    for i in range (std_count):
        invite_obj = {"email":"{}@{}.com".format(randomString(),randomString()) ,"phone":""}
        invites.append(invite_obj)
        
    data = str(invites).replace("'", "\"")

    start = time.time()
    response = requests.post('http://localhost:5000/api/courses/d9eccc00-5c38-11ea-afc9-77bc797bb6e1/students', headers=headers, cookies=cookies, data=data)
    print (response.status_code)
    done = time.time()
    elapsed = done - start
    time_list.append(elapsed)
    print ('=======================================================')
    print ('time to add {} students = {}'.format(std_count, elapsed))
    print ('=======================================================')

print ('=== time list ===')
print (time_list)

and I drew the graph using this.

import matplotlib.pyplot as plt
import numpy as np

# citext 50 * 20 students * 6
d1 = [0.266568660736084, 0.22017741203308105, 0.3671255111694336, 0.16453933715820312, 0.20105981826782227, 0.14994263648986816, 0.1887807846069336, 0.24911260604858398, 0.23454689979553223, 0.26441383361816406, 0.29665279388427734, 0.3174870014190674, 0.2555522918701172, 0.44712162017822266, 0.5866923332214355, 0.2815675735473633, 0.390960693359375, 0.3135251998901367, 0.20898699760437012, 0.3151123523712158]
d2 = [0.4194824695587158, 0.2872183322906494, 0.3421797752380371, 0.4111201763153076, 0.6233277320861816, 0.3352317810058594, 0.2553877830505371, 0.2887136936187744, 0.3013749122619629, 0.2992098331451416, 0.42786526679992676, 0.43163585662841797, 0.4313781261444092, 0.6631267070770264, 0.4301183223724365, 0.3605995178222656, 0.3932652473449707, 0.4308328628540039, 0.4366154670715332, 0.34690237045288086]
d3 = [0.40212249755859375, 0.3169081211090088, 0.30905771255493164, 0.6510269641876221, 0.517207145690918, 0.3624258041381836, 0.42569637298583984, 0.4027881622314453, 0.4689486026763916, 0.41178226470947266, 0.4059157371520996, 0.40392231941223145, 0.48705601692199707, 0.7772712707519531, 0.6329045295715332, 0.4490194320678711, 0.37381744384765625, 0.4095191955566406, 0.3946213722229004, 0.576892614364624]
d4 = [0.5932729244232178, 0.7167961597442627, 0.5007412433624268, 0.4764072895050049, 0.40761494636535645, 0.4529299736022949, 0.43738842010498047, 0.386765718460083, 0.4669950008392334, 0.40462231636047363, 0.49130868911743164, 0.506608247756958, 0.8667562007904053, 0.4699563980102539, 0.48488950729370117, 0.3970503807067871, 0.446744441986084, 0.46022939682006836, 0.5286579132080078, 0.49848222732543945]
d5 = [0.8467874526977539, 0.5174136161804199, 0.49863696098327637, 0.8237037658691406, 0.4489142894744873, 0.5582444667816162, 0.489959716796875, 0.5892529487609863, 0.46962928771972656, 0.4958314895629883, 0.517115592956543, 0.6795744895935059, 1.0857610702514648, 0.6503419876098633, 0.5802977085113525, 0.6027395725250244, 0.5201141834259033, 0.5682616233825684, 0.5818808078765869, 0.5678596496582031]
d6 = [0.7770664691925049, 0.8298671245574951, 0.960148811340332, 0.6181957721710205, 0.557952880859375, 0.5344274044036865, 0.595778226852417, 0.5732638835906982, 0.5536572933197021, 0.602863073348999, 0.7123429775238037, 0.7083063125610352, 1.1479206085205078, 0.6791918277740479, 0.9836521148681641, 0.8168818950653076, 0.9379119873046875, 0.6814308166503906, 0.8282256126403809, 0.7156720161437988]

# text 50 * 20 students * 6
d7 = [0.279937744140625, 0.23598623275756836, 0.21775507926940918, 0.30899786949157715, 0.22371554374694824, 0.18370437622070312, 0.20546555519104004, 0.248138427734375, 0.26404500007629395, 0.21433687210083008, 0.23470592498779297, 0.22337079048156738, 0.21856284141540527, 0.22962355613708496, 0.23736262321472168, 0.2391796112060547, 0.47968173027038574, 0.26830554008483887, 0.2835202217102051, 0.25125741958618164]
d8 = [0.21895170211791992, 0.21545815467834473, 0.8196189403533936, 0.4356727600097656, 0.2630171775817871, 0.28411269187927246, 0.22447896003723145, 0.30243635177612305, 0.3748972415924072, 0.29362940788269043, 0.2577536106109619, 0.30362939834594727, 0.2919270992279053, 0.26994895935058594, 0.2734558582305908, 0.2991297245025635, 0.3551626205444336, 0.2896413803100586, 0.5001449584960938, 0.43639230728149414]
d9 = [0.32576489448547363, 0.2967398166656494, 0.29813575744628906, 0.2977607250213623, 0.3206901550292969, 0.29518580436706543, 0.32353639602661133, 0.31189608573913574, 0.6475155353546143, 0.37693214416503906, 0.33748817443847656, 0.3357844352722168, 0.32373690605163574, 0.3539614677429199, 0.3262145519256592, 0.35153746604919434, 0.3395388126373291, 0.35877037048339844, 0.7895276546478271, 0.44710850715637207]
d10 = [0.3533039093017578, 0.34291553497314453, 0.35086607933044434, 0.36339664459228516, 0.380352258682251, 0.38174009323120117, 0.39342284202575684, 0.4010028839111328, 0.7097485065460205, 0.4389493465423584, 0.4720902442932129, 0.41950345039367676, 0.46787023544311523, 0.42903566360473633, 0.42014288902282715, 0.43090057373046875, 0.43491435050964355, 0.44077348709106445, 0.6885054111480713, 0.4220433235168457]
d11 = [0.458207368850708, 0.43941760063171387, 0.41616153717041016, 0.4538130760192871, 0.44947218894958496, 0.4641869068145752, 0.4974992275238037, 0.4924912452697754, 0.785752534866333, 0.5707685947418213, 0.46414661407470703, 0.4771432876586914, 0.48201894760131836, 0.49654293060302734, 0.4824507236480713, 0.49565577507019043, 0.5078363418579102, 0.5011448860168457, 0.9532656669616699, 0.507800817489624]
d12 = [0.5501739978790283, 0.5057566165924072, 0.8209824562072754, 0.5610778331756592, 0.5032262802124023, 0.5505037307739258, 0.5545287132263184, 0.5311133861541748, 0.5273199081420898, 0.5304994583129883, 0.5430409908294678, 0.5651016235351562, 0.9624083042144775, 0.5643124580383301, 0.5478610992431641, 0.5946972370147705, 0.5513448715209961, 0.5626697540283203, 0.582388162612915, 0.5900301933288574]


def get_avg(li):
    return (sum(li) / len(li))

avg_list_citext = []
dlist_citext = [d1, d2, d3, d4, d5, d6]
for i in dlist_citext:
    avg_list_citext.append(get_avg(i))

std_count = 1000
for i in avg_list_citext:
    plt.plot(std_count, i, 'bo')
    std_count += 1000

std_count = 1000
avg_list_text = []
dlist_text = [d7, d8, d9, d10, d11, d12]
for i in dlist_text:
    avg_list_text.append(get_avg(i))

std_count = 1000
for i in avg_list_text:
    plt.plot(std_count, i, 'bo', color='r')
    std_count += 1000

plt.xlabel('students count')
plt.ylabel('time (s)')
plt.title('Time to add 50*20*6 students to invite table | CITEXT-blue')
plt.show()

@hddananjaya
Copy link
Author

But this is what happened when selecting data from the course.
citext_when_reading

Code that I used for automating requests for selecting.

import os
import random
import string
import requests
import time


def randomString(stringLength=10):
    """Generate a random string of fixed length """
    letters = string.ascii_lowercase
    return ''.join(random.choice(letters) for i in range(stringLength))


cookies = {
    'userSession': 'eyJhbGciOiJIUzI1NiIsInR5cCI6IkpXVCJ9.eyJkaWQiOiJ1bnZlcmlmaWVkLTdiYjZkYmMwLTU5ZGMtMTFlYS1iZDliLTQxZmNkMDFhNjZmNSIsInR5cGUiOjAsInVzZXJSb2xlIjoiaXNzdWVyIiwiY29udGFjdCI6NiwicGVybWlzc2lvbnMiOlsidGVhY2hlcjpyZWFkIiwidGVhY2hlcjp3cml0ZSIsInN0dWRlbnQ6cmVhZCIsInN0dWRlbnQ6d3JpdGUiLCJhZG1pbiJdLCJpYXQiOjE1ODMxNDUyNDUsImV4cCI6MTU4NDM1NDg0NX0.eqXdWo-6wz6gJ4jmx6yAsC7mE3Npkaz4IUJD1QUhsr0',
    'intercom-session-bv38u4jk': 'cEFqeHlyM3ZGVnNtaVlJL05CN3YyTjRrdktnZzJDekFtTEZNanp5bzJMeVlaOUxzVXpxNG82OFFZdlZnOExudC0teWdOaFVGZG5rWlVDbjlqUFpwYmx4Zz09--7de7f1af77f832f6be644595e72a51e2d3dd0323',
}

headers = {
    'Connection': 'keep-alive',
    'Accept': 'application/json, text/plain, */*',
    'Origin': 'http://localhost:3000',
    'Sec-Fetch-Dest': 'empty',
    'User-Agent': 'Mozilla/5.0 (Linux; Android 6.0; Nexus 5 Build/MRA58N) AppleWebKit/537.36 (KHTML, like Gecko) Chrome/80.0.3987.87 Mobile Safari/537.36',
    'Content-Type': 'application/json;charset=UTF-8',
    'Sec-Fetch-Site': 'same-site',
    'Sec-Fetch-Mode': 'cors',
    'Referer': 'http://localhost:3000/courses/de33b7f0-59dc-11ea-bd9b-41fcd01a66f5/waiting',
    'Accept-Language': 'en-US,en;q=0.9',
}

time_pairs = []


def insertStudents ():
    time_list = []

    invites = []
    for i in range (500):
        invite_obj = {"email":"{}@{}.com".format(randomString(),randomString()) ,"phone":""}
        invites.append(invite_obj)
        
    data = str(invites).replace("'", "\"")

    start = time.time()
    response = requests.post('http://localhost:5000/api/courses/de33b7f0-59dc-11ea-bd9b-41fcd01a66f5/students', headers=headers, cookies=cookies, data=data)
    # print (response.content)
    print (response.status_code)
    done = time.time()
    elapsed = done - start
    time_list.append(elapsed)
    print ('=======================================================')
    print ('time to add {} students = {}'.format(500, elapsed))
    print ('=======================================================')


def readTheCourse ():
    start = time.time()
    response = requests.get('http://localhost:5000/api/courses/de33b7f0-59dc-11ea-bd9b-41fcd01a66f5', headers=headers, cookies=cookies)
    print (response.status_code)
    done = time.time()
    elapsed = done - start
    print ('=======================================================')
    print ('time to read  students = {}'.format(elapsed))
    print ('=======================================================')
    return elapsed

std_count = 500
for i in range (12):
    sc = insertStudents()
    rt = readTheCourse()
    time_pairs.append([std_count, rt])
    std_count += 500

print (time_pairs)

Code for the plotting

# TEXT - TIME TO READ 500 * 5 USERS
# a1 = [[500, 0.34286046028137207], [1000, 0.47170305252075195], [1500, 0.3104379177093506], [2000, 0.682849645614624], [2500, 0.4806191921234131], [3000, 0.5650701522827148], [3500, 0.7414286136627197], [4000, 1.105724573135376], [4500, 0.7980315685272217], [5000, 0.800025463104248], [5500, 0.9555141925811768], [6000, 1.2277131080627441]]
# a2 = [[500, 0.13019156455993652], [1000, 0.263568639755249], [1500, 0.3995523452758789], [2000, 0.4489591121673584], [2500, 0.47824621200561523], [3000, 0.5015416145324707], [3500, 0.6623961925506592], [4000, 0.7547996044158936], [4500, 0.9457859992980957], [5000, 0.991969108581543], [5500, 1.1358506679534912], [6000, 1.2357127666473389]]
# a3 = [[500, 0.1408100128173828], [1000, 0.29343199729919434], [1500, 0.4946134090423584], [2000, 0.32529330253601074], [2500, 0.4150521755218506], [3000, 0.615856409072876], [3500, 0.6550290584564209], [4000, 1.0073726177215576], [4500, 0.7512013912200928], [5000, 0.9377298355102539], [5500, 1.0177783966064453], [6000, 1.0712096691131592]]
# a4 = [[500, 0.16573071479797363], [1000, 0.19810247421264648], [1500, 0.3581531047821045], [2000, 0.3840639591217041], [2500, 0.5157613754272461], [3000, 0.5872955322265625], [3500, 1.1438641548156738], [4000, 0.6829550266265869], [4500, 0.7732465267181396], [5000, 0.8749711513519287], [5500, 1.16654634475708], [6000, 1.2111494541168213]]

# CITEXT
# a1 = [[500, 0.09650850296020508], [1000, 0.1687312126159668], [1500, 0.16428780555725098], [2000, 0.24415826797485352], [2500, 0.25140881538391113], [3000, 0.44766926765441895], [3500, 0.8470873832702637], [4000, 0.3614680767059326], [4500, 0.4939579963684082], [5000, 0.5424118041992188], [5500, 0.5474159717559814], [6000, 0.5735747814178467]]
# a2 = [[500, 0.13007211685180664], [1000, 0.1435530185699463], [1500, 0.15303421020507812], [2000, 0.37621521949768066], [2500, 0.2706887722015381], [3000, 0.3150627613067627], [3500, 0.3207244873046875], [4000, 0.9831936359405518], [4500, 0.4183931350708008], [5000, 0.5881309509277344], [5500, 0.5477564334869385], [6000, 0.5795495510101318]]
# a3 = [[500, 0.10593080520629883], [1000, 0.3265695571899414], [1500, 0.21654129028320312], [2000, 0.2338113784790039], [2500, 0.8468258380889893], [3000, 0.34406542778015137], [3500, 0.3827545642852783], [4000, 0.42885565757751465], [4500, 0.6385164260864258], [5000, 1.6137914657592773], [5500, 0.506544828414917], [6000, 0.6388683319091797]]
# a4 = [[500, 0.10300540924072266], [1000, 0.13686919212341309], [1500, 0.22192788124084473], [2000, 0.21599149703979492], [2500, 0.26786327362060547], [3000, 0.3512897491455078], [3500, 0.7787292003631592], [4000, 0.3783097267150879], [4500, 0.45909547805786133], [5000, 0.42559170722961426], [5500, 0.5210475921630859], [6000, 0.5187411308288574]]


# avgs = []
# d = 500
# for i in range(len(a1)):
#     av = (a1[i][1] + a2[i][1] + a3[i][1] + a4[i][1]) / 4
#     avgs.append((d, av))
#     d += 500

# print (avgs)


import matplotlib.pyplot as plt
import numpy as np

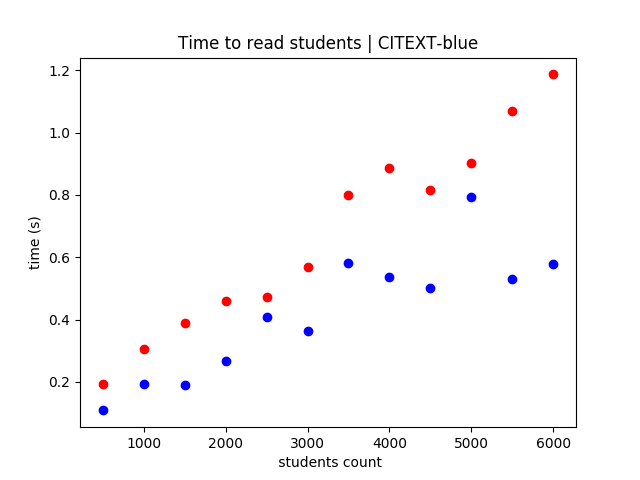
avg_citext = [(500, 0.1088792085647583), (1000, 0.1939307451248169), (1500, 0.18894779682159424), (2000, 0.26754409074783325), (2500, 0.409196674823761), (3000, 0.3645218014717102), (3500, 0.5823239088058472), (4000, 0.5379567742347717), (4500, 0.502490758895874), (5000, 0.7924814820289612), (5500, 0.5306912064552307), (6000, 0.5776834487915039)]
avg_text = [(500, 0.19489818811416626), (1000, 0.30670154094696045), (1500, 0.3906891942024231), (2000, 0.4602915048599243), (2500, 0.47241973876953125), (3000, 0.567440927028656), (3500, 0.8006795048713684), (4000, 0.8877129554748535), (4500, 0.8170663714408875), (5000, 0.9011738896369934), (5500, 1.0689224004745483), (6000, 1.1864462494850159)]


for i in avg_citext:
    plt.plot(i[0], i[1], 'bo', color='b')

for i in avg_text:
    plt.plot(i[0], i[1], 'bo', color='r')


plt.xlabel(' students count')
plt.ylabel('time (s)')
plt.title('Time to read students | CITEXT-blue')
plt.show()

Sign up for free to join this conversation on GitHub. Already have an account? Sign in to comment