Skip to content

Instantly share code, notes, and snippets.

@hddananjaya
Last active June 2, 2020 11:40
Show Gist options
  • Save hddananjaya/5b9d567d00799e69552c53be82ced866 to your computer and use it in GitHub Desktop.
Save hddananjaya/5b9d567d00799e69552c53be82ced866 to your computer and use it in GitHub Desktop.
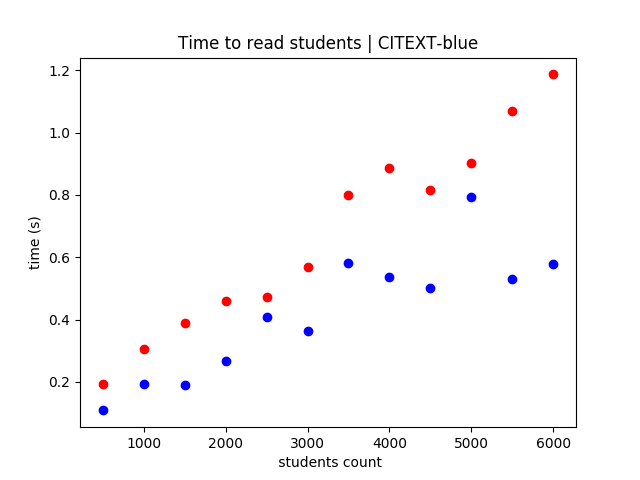
Postgres CITEXT vs TEXT performance
@hddananjaya
Copy link
Author

But this is what happened when selecting data from the course.
citext_when_reading

Code that I used for automating requests for selecting.

import os
import random
import string
import requests
import time


def randomString(stringLength=10):
    """Generate a random string of fixed length """
    letters = string.ascii_lowercase
    return ''.join(random.choice(letters) for i in range(stringLength))


cookies = {
    'userSession': 'eyJhbGciOiJIUzI1NiIsInR5cCI6IkpXVCJ9.eyJkaWQiOiJ1bnZlcmlmaWVkLTdiYjZkYmMwLTU5ZGMtMTFlYS1iZDliLTQxZmNkMDFhNjZmNSIsInR5cGUiOjAsInVzZXJSb2xlIjoiaXNzdWVyIiwiY29udGFjdCI6NiwicGVybWlzc2lvbnMiOlsidGVhY2hlcjpyZWFkIiwidGVhY2hlcjp3cml0ZSIsInN0dWRlbnQ6cmVhZCIsInN0dWRlbnQ6d3JpdGUiLCJhZG1pbiJdLCJpYXQiOjE1ODMxNDUyNDUsImV4cCI6MTU4NDM1NDg0NX0.eqXdWo-6wz6gJ4jmx6yAsC7mE3Npkaz4IUJD1QUhsr0',
    'intercom-session-bv38u4jk': 'cEFqeHlyM3ZGVnNtaVlJL05CN3YyTjRrdktnZzJDekFtTEZNanp5bzJMeVlaOUxzVXpxNG82OFFZdlZnOExudC0teWdOaFVGZG5rWlVDbjlqUFpwYmx4Zz09--7de7f1af77f832f6be644595e72a51e2d3dd0323',
}

headers = {
    'Connection': 'keep-alive',
    'Accept': 'application/json, text/plain, */*',
    'Origin': 'http://localhost:3000',
    'Sec-Fetch-Dest': 'empty',
    'User-Agent': 'Mozilla/5.0 (Linux; Android 6.0; Nexus 5 Build/MRA58N) AppleWebKit/537.36 (KHTML, like Gecko) Chrome/80.0.3987.87 Mobile Safari/537.36',
    'Content-Type': 'application/json;charset=UTF-8',
    'Sec-Fetch-Site': 'same-site',
    'Sec-Fetch-Mode': 'cors',
    'Referer': 'http://localhost:3000/courses/de33b7f0-59dc-11ea-bd9b-41fcd01a66f5/waiting',
    'Accept-Language': 'en-US,en;q=0.9',
}

time_pairs = []


def insertStudents ():
    time_list = []

    invites = []
    for i in range (500):
        invite_obj = {"email":"{}@{}.com".format(randomString(),randomString()) ,"phone":""}
        invites.append(invite_obj)
        
    data = str(invites).replace("'", "\"")

    start = time.time()
    response = requests.post('http://localhost:5000/api/courses/de33b7f0-59dc-11ea-bd9b-41fcd01a66f5/students', headers=headers, cookies=cookies, data=data)
    # print (response.content)
    print (response.status_code)
    done = time.time()
    elapsed = done - start
    time_list.append(elapsed)
    print ('=======================================================')
    print ('time to add {} students = {}'.format(500, elapsed))
    print ('=======================================================')


def readTheCourse ():
    start = time.time()
    response = requests.get('http://localhost:5000/api/courses/de33b7f0-59dc-11ea-bd9b-41fcd01a66f5', headers=headers, cookies=cookies)
    print (response.status_code)
    done = time.time()
    elapsed = done - start
    print ('=======================================================')
    print ('time to read  students = {}'.format(elapsed))
    print ('=======================================================')
    return elapsed

std_count = 500
for i in range (12):
    sc = insertStudents()
    rt = readTheCourse()
    time_pairs.append([std_count, rt])
    std_count += 500

print (time_pairs)

Code for the plotting

# TEXT - TIME TO READ 500 * 5 USERS
# a1 = [[500, 0.34286046028137207], [1000, 0.47170305252075195], [1500, 0.3104379177093506], [2000, 0.682849645614624], [2500, 0.4806191921234131], [3000, 0.5650701522827148], [3500, 0.7414286136627197], [4000, 1.105724573135376], [4500, 0.7980315685272217], [5000, 0.800025463104248], [5500, 0.9555141925811768], [6000, 1.2277131080627441]]
# a2 = [[500, 0.13019156455993652], [1000, 0.263568639755249], [1500, 0.3995523452758789], [2000, 0.4489591121673584], [2500, 0.47824621200561523], [3000, 0.5015416145324707], [3500, 0.6623961925506592], [4000, 0.7547996044158936], [4500, 0.9457859992980957], [5000, 0.991969108581543], [5500, 1.1358506679534912], [6000, 1.2357127666473389]]
# a3 = [[500, 0.1408100128173828], [1000, 0.29343199729919434], [1500, 0.4946134090423584], [2000, 0.32529330253601074], [2500, 0.4150521755218506], [3000, 0.615856409072876], [3500, 0.6550290584564209], [4000, 1.0073726177215576], [4500, 0.7512013912200928], [5000, 0.9377298355102539], [5500, 1.0177783966064453], [6000, 1.0712096691131592]]
# a4 = [[500, 0.16573071479797363], [1000, 0.19810247421264648], [1500, 0.3581531047821045], [2000, 0.3840639591217041], [2500, 0.5157613754272461], [3000, 0.5872955322265625], [3500, 1.1438641548156738], [4000, 0.6829550266265869], [4500, 0.7732465267181396], [5000, 0.8749711513519287], [5500, 1.16654634475708], [6000, 1.2111494541168213]]

# CITEXT
# a1 = [[500, 0.09650850296020508], [1000, 0.1687312126159668], [1500, 0.16428780555725098], [2000, 0.24415826797485352], [2500, 0.25140881538391113], [3000, 0.44766926765441895], [3500, 0.8470873832702637], [4000, 0.3614680767059326], [4500, 0.4939579963684082], [5000, 0.5424118041992188], [5500, 0.5474159717559814], [6000, 0.5735747814178467]]
# a2 = [[500, 0.13007211685180664], [1000, 0.1435530185699463], [1500, 0.15303421020507812], [2000, 0.37621521949768066], [2500, 0.2706887722015381], [3000, 0.3150627613067627], [3500, 0.3207244873046875], [4000, 0.9831936359405518], [4500, 0.4183931350708008], [5000, 0.5881309509277344], [5500, 0.5477564334869385], [6000, 0.5795495510101318]]
# a3 = [[500, 0.10593080520629883], [1000, 0.3265695571899414], [1500, 0.21654129028320312], [2000, 0.2338113784790039], [2500, 0.8468258380889893], [3000, 0.34406542778015137], [3500, 0.3827545642852783], [4000, 0.42885565757751465], [4500, 0.6385164260864258], [5000, 1.6137914657592773], [5500, 0.506544828414917], [6000, 0.6388683319091797]]
# a4 = [[500, 0.10300540924072266], [1000, 0.13686919212341309], [1500, 0.22192788124084473], [2000, 0.21599149703979492], [2500, 0.26786327362060547], [3000, 0.3512897491455078], [3500, 0.7787292003631592], [4000, 0.3783097267150879], [4500, 0.45909547805786133], [5000, 0.42559170722961426], [5500, 0.5210475921630859], [6000, 0.5187411308288574]]


# avgs = []
# d = 500
# for i in range(len(a1)):
#     av = (a1[i][1] + a2[i][1] + a3[i][1] + a4[i][1]) / 4
#     avgs.append((d, av))
#     d += 500

# print (avgs)


import matplotlib.pyplot as plt
import numpy as np

avg_citext = [(500, 0.1088792085647583), (1000, 0.1939307451248169), (1500, 0.18894779682159424), (2000, 0.26754409074783325), (2500, 0.409196674823761), (3000, 0.3645218014717102), (3500, 0.5823239088058472), (4000, 0.5379567742347717), (4500, 0.502490758895874), (5000, 0.7924814820289612), (5500, 0.5306912064552307), (6000, 0.5776834487915039)]
avg_text = [(500, 0.19489818811416626), (1000, 0.30670154094696045), (1500, 0.3906891942024231), (2000, 0.4602915048599243), (2500, 0.47241973876953125), (3000, 0.567440927028656), (3500, 0.8006795048713684), (4000, 0.8877129554748535), (4500, 0.8170663714408875), (5000, 0.9011738896369934), (5500, 1.0689224004745483), (6000, 1.1864462494850159)]


for i in avg_citext:
    plt.plot(i[0], i[1], 'bo', color='b')

for i in avg_text:
    plt.plot(i[0], i[1], 'bo', color='r')


plt.xlabel(' students count')
plt.ylabel('time (s)')
plt.title('Time to read students | CITEXT-blue')
plt.show()

Sign up for free to join this conversation on GitHub. Already have an account? Sign in to comment