-
-
Save hitvoice/36cf44689065ca9b927431546381a3f7 to your computer and use it in GitHub Desktop.

| import numpy as np | |
| import pandas as pd | |
| import matplotlib.pyplot as plt | |
| import seaborn as sns | |
| from sklearn.metrics import confusion_matrix | |
| def cm_analysis(y_true, y_pred, filename, labels, ymap=None, figsize=(10,10)): | |
| """ | |
| Generate matrix plot of confusion matrix with pretty annotations. | |
| The plot image is saved to disk. | |
| args: | |
| y_true: true label of the data, with shape (nsamples,) | |
| y_pred: prediction of the data, with shape (nsamples,) | |
| filename: filename of figure file to save | |
| labels: string array, name the order of class labels in the confusion matrix. | |
| use `clf.classes_` if using scikit-learn models. | |
| with shape (nclass,). | |
| ymap: dict: any -> string, length == nclass. | |
| if not None, map the labels & ys to more understandable strings. | |
| Caution: original y_true, y_pred and labels must align. | |
| figsize: the size of the figure plotted. | |
| """ | |
| if ymap is not None: | |
| y_pred = [ymap[yi] for yi in y_pred] | |
| y_true = [ymap[yi] for yi in y_true] | |
| labels = [ymap[yi] for yi in labels] | |
| cm = confusion_matrix(y_true, y_pred, labels=labels) | |
| cm_sum = np.sum(cm, axis=1, keepdims=True) | |
| cm_perc = cm / cm_sum.astype(float) * 100 | |
| annot = np.empty_like(cm).astype(str) | |
| nrows, ncols = cm.shape | |
| for i in range(nrows): | |
| for j in range(ncols): | |
| c = cm[i, j] | |
| p = cm_perc[i, j] | |
| if i == j: | |
| s = cm_sum[i] | |
| annot[i, j] = '%.1f%%\n%d/%d' % (p, c, s) | |
| elif c == 0: | |
| annot[i, j] = '' | |
| else: | |
| annot[i, j] = '%.1f%%\n%d' % (p, c) | |
| cm = pd.DataFrame(cm, index=labels, columns=labels) | |
| cm.index.name = 'Actual' | |
| cm.columns.name = 'Predicted' | |
| fig, ax = plt.subplots(figsize=figsize) | |
| sns.heatmap(cm, annot=annot, fmt='', ax=ax) | |
| plt.savefig(filename) |
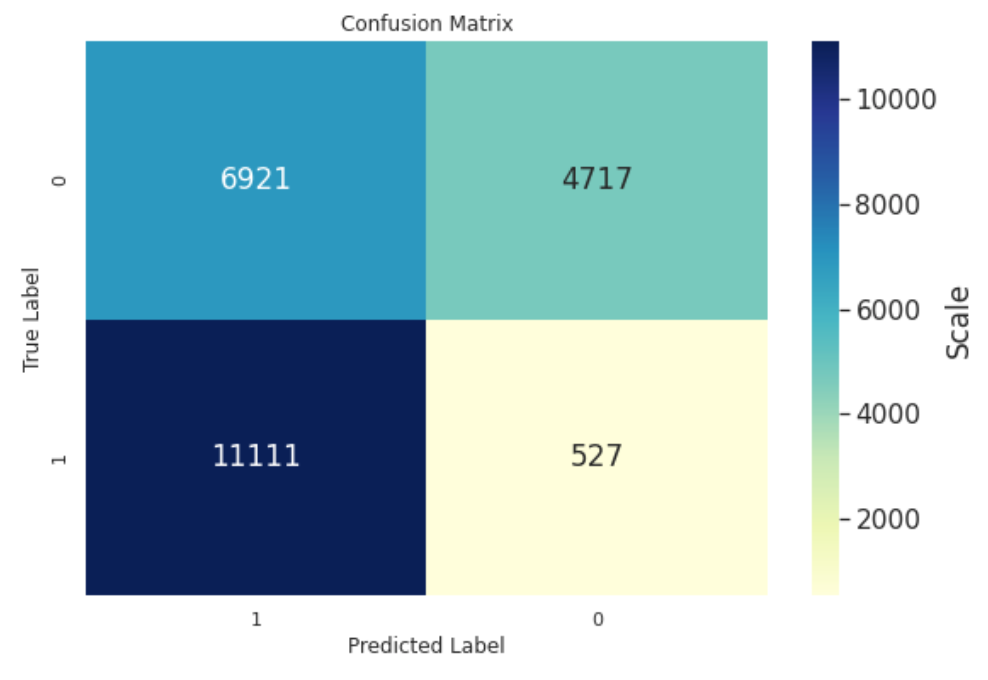
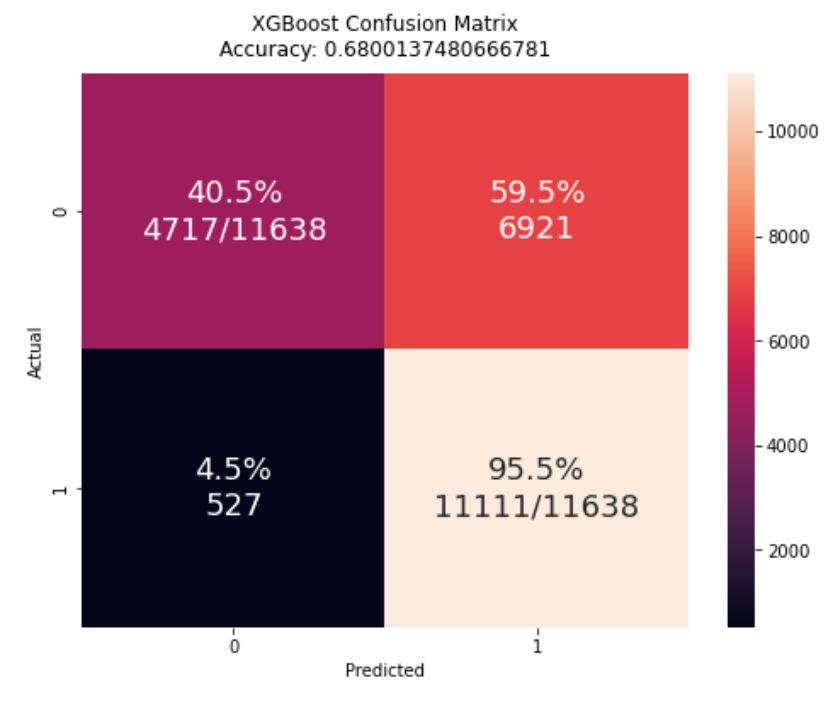
Hi Hitvoice - this is awesome! Thanks so much posting this. I'm trying it out and see an odd thing with my binary classification CM. I've posted your version and what I get from using confusion_matrix. You can see that the classes are transposed and I'm wondering if I'm doing something wrong. I'd like to keep this aligned to what confusion_matrix displays so I thought I'd ask.
What do you mean by "the classes are transposed"? Do you mean the order of 0 and 1?
Do you mean the order of 0 and 1?
Yes, I was looking to align this with sklearn's confusion matrix for consistency. Perhaps a parameter could be passed to indicate the order since various references have a different convention for the axes.
You can see from the code that the matrix is indeed computed from sklearn's "confusion_matrix" function. How did you get the first figure? If you prefer that kind of style, you can reorder the dataframe columns by cm = cm[cm.columns[::-1]] before creating the plot.
@hitvoice, it's really appreciated work. how to changet the clf.classes_ to other, for instance my classess are from 0 to 8, but i want to change those labels to string.
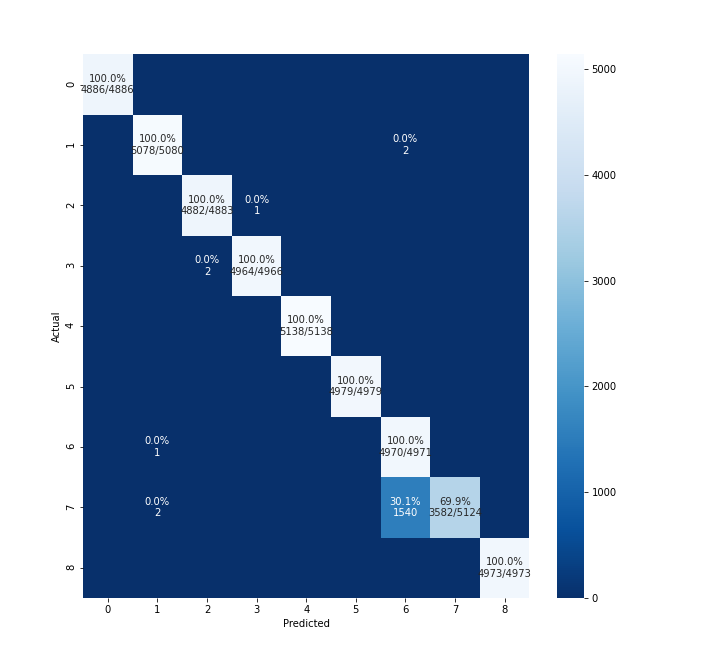
@rajeshkalakoti pass the value of ymap (dict[Any,str]) to cm_analysis. You can configure the class names in ymap.
for instance, labels are like "class-1, class-2,class-3, class-4,class-5, class-6,class-7, class-8,classs-9", how to configure it?
Hi Hitvoice - this is awesome! Thanks so much posting this. I'm trying it out and see an odd thing with my binary classification CM. I've posted your version and what I get from using confusion_matrix. You can see that the classes are transposed and I'm wondering if I'm doing something wrong. I'd like to keep this aligned to what confusion_matrix displays so I thought I'd ask.