Skip to content

Instantly share code, notes, and snippets.

@jorgemorgado
Last active December 8, 2022 08:54
Show Gist options
  • Star 12 You must be signed in to star a gist
  • Fork 0 You must be signed in to fork a gist
  • Save jorgemorgado/26068a72540619a4d4ec to your computer and use it in GitHub Desktop.
Save jorgemorgado/26068a72540619a4d4ec to your computer and use it in GitHub Desktop.
Sparkline chart widget for Dashing

dashing-sparkline

Preview

Sparkline

Description

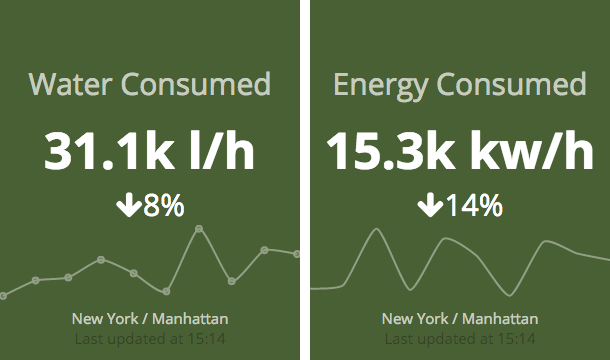
A Dashing widget (and associated job) to display a sparkline graph. It also displays the current value and the percentage difference (from the previous value), pretty much like the Number widget.

A sparkline is a very small line chart, typically drawn without axes or coordinates. It presents the general shape of the variation (typically over time) in some measurement, such as temperature or stock market price, in a simple and highly condensed way (from https://en.wikipedia.org/wiki/Sparkline).

The sparkline is drawn using the Rickshaw Graph framework just like the default Graph widget.

Installation

Create a folder in your widgets directory called sparkline. Insert the three files (sparkline.coffee, sparkline.html and sparkline.scss).

Alternately, you can use the automated dashing installer by running dashing install 26068a72540619a4d4ec from the root of your dashing project.

Usage

Add the following code on the desired dashboard:

<li data-row="1" data-col="1" data-sizex="1" data-sizey="1">
  <div data-id="water_main_city" data-view="Sparkline" data-title="Water Consumed" data-moreinfo="Main City" data-graphtype="lineplot" data-suffix=" l/h"></div>
</li>

You can change the data-graphtype. Options include lineplot, line, area and bar. Other options supported by Rickshaw.Graph should also work but they might not look very nice for a sparkline.

Create your sparkline job my_sparkline_job.rb. Example:

# Populate the graph with some random points
points = []
(1..10).each do |i|
  points << { x: i, y: rand(50000) }
end
last_x = points.last[:x]

SCHEDULER.every '60m' do

  points.shift
  last_x += 1
  points << { x: last_x, y: rand(50000) }

  send_event('water_main_city', points: points)
end

Alternatively you can also send data via HTTP post. Example using curl:

curl -d '{
  "auth_token": "YOUR_AUTH_TOKEN",
  "points":
    [
      { "x": "1",  "y": "10" },
      { "x": "2",  "y": "20" },
      { "x": "3",  "y": "70" },
      { "x": "4",  "y": "60" },
      { "x": "5",  "y": "10" },
      { "x": "6",  "y": "80" },
      { "x": "7",  "y": "90" },
      { "x": "8",  "y": "40" },
      { "x": "9",  "y": "30" },
      { "x": "10", "y": "10" }
    ]
  }' \
http://localhost:3030/widgets/water_main_city

Contributors

License

This widget is released under the MIT License.
The MIT License (MIT)

Copyright (c) 2015 Jorge Morgado

Permission is hereby granted, free of charge, to any person obtaining a copy of this software and associated documentation files (the "Software"), to deal in the Software without restriction, including without limitation the rights to use, copy, modify, merge, publish, distribute, sublicense, and/or sell copies of the Software, and to permit persons to whom the Software is furnished to do so, subject to the following conditions:

The above copyright notice and this permission notice shall be included in all copies or substantial portions of the Software.

THE SOFTWARE IS PROVIDED "AS IS", WITHOUT WARRANTY OF ANY KIND, EXPRESS OR IMPLIED, INCLUDING BUT NOT LIMITED TO THE WARRANTIES OF MERCHANTABILITY, FITNESS FOR A PARTICULAR PURPOSE AND NONINFRINGEMENT. IN NO EVENT SHALL THE AUTHORS OR COPYRIGHT HOLDERS BE LIABLE FOR ANY CLAIM, DAMAGES OR OTHER LIABILITY, WHETHER IN AN ACTION OF CONTRACT, TORT OR OTHERWISE, ARISING FROM, OUT OF OR IN CONNECTION WITH THE SOFTWARE OR THE USE OR OTHER DEALINGS IN THE SOFTWARE.

# Populate the graph with some random points
points = []
(1..10).each do |i|
points << { x: i, y: rand(50000) }
end
last_x = points.last[:x]
SCHEDULER.every '60m' do
points.shift
last_x += 1
points << { x: last_x, y: rand(50000) }
send_event('water_main_city', points: points)
end
class Dashing.Sparkline extends Dashing.Widget
@accessor 'current', ->
if @get('points')
points = @get('points')
points[points.length - 1].y
else
""
@accessor 'difference', ->
if @get('points')
points = @get('points')
current = parseInt(points[points.length - 1].y)
last = parseInt(points[points.length - 2].y)
if last != 0
diff = Math.abs(Math.round((current - last) / last * 100))
"#{diff}%"
else
"100%"
else
""
@accessor 'arrow', ->
if @get('points')
points = @get('points')
current = parseInt(points[points.length - 1].y)
last = parseInt(points[points.length - 2].y)
if current >= last then 'icon-arrow-up' else 'icon-arrow-down'
ready: ->
container = $(@node).parent()
# Gross hacks. Let's fix this.
width = (Dashing.widget_base_dimensions[0] * container.data('sizex')) + Dashing.widget_margins[0] * 2 * (container.data('sizex') - 1)
height = (Dashing.widget_base_dimensions[1] * container.data('sizey'))
# Make the sparkline graph 1/5 of the widget's height
height /= 5
$graph = $("<div class='sparkline-container' style='height:#{height}px;'></div>")
$(@node).append $graph
@graph = new Rickshaw.Graph(
element: $graph.get(0)
width: width
height: height
renderer: @get('graphtype')
series: [{
color: '#fff',
data: [{x:0, y:0}]
}]
)
if @get('points')
@graph.series[0].data = @get('points')
@graph.render()
onData: (data) ->
if @graph && data.points
@graph.series[0].data = data.points
@graph.render()
<h1 class="title" data-bind="title"></h1>
<h2 class="value" data-bind="current | shortenedNumber | prepend prefix | append suffix"></h2>
<p class="change-rate">
<i data-bind-class="arrow"></i><span data-bind="difference"></span>
</p>
<p class="more-info" data-bind="moreinfo"></p>
<p class="updated-at" data-bind="updatedAtMessage"></p>
// ----------------------------------------------------------------------------
// Sass declarations
// ----------------------------------------------------------------------------
$background-color: #495f34;
$value-color: #fff;
$title-color: rgba(255, 255, 255, 0.7);
$moreinfo-color: rgba(255, 255, 255, 0.7);
// ----------------------------------------------------------------------------
// Widget-sparkline styles
// ----------------------------------------------------------------------------
.widget-sparkline {
background-color: $background-color;
position: relative;
div.sparkline-container {
// border:1px solid black;
margin-left: -12px;
margin-right: -12px;
}
svg {
// border:1px solid red;
position: block;
opacity: 0.4;
fill-opacity: 0.4;
padding: 3px 0px 4px;
width: 100%;
}
.title {
color: $title-color;
}
.value {
color: $value-color;
font-size:2.5em;
text-transform: lowercase;
}
.change-rate {
font-weight: 500;
font-size: 30px;
color: $value-color;
}
.more-info {
color: $moreinfo-color;
}
.updated-at {
color: rgba(0, 0, 0, 0.3);
}
.x_tick, .y_ticks, .domain {
display: none;
}
}
@iwelch82
Copy link

For some reason when I run HTTP post the scale of the sparkline appears to go to 100 points instead of 10points. Is there a way to control the number of points displayed on the X axis?
{ "auth_token": "*****", "points": [ {"y": 2, "x": "1"}, {"y": 2, "x": "2"}, {"y": 1, "x": "3"}, {"y": 4, "x": "4"}, {"y": 1, "x": "5"}, {"y": 2, "x": "6"}, {"y": 1, "x": "7"}, {"y": 3, "x": "8"}, {"y": 4, "x": "9"}, {"y": 2, "x": "10"}, {"y": 3, "x": "11"}, {"y": 3, "x": "12"}, {"y": 18, "x": "13"} ] }
image

Sign up for free to join this conversation on GitHub. Already have an account? Sign in to comment