-
-
Save karussell/a8203e66c4fea399d94189570be89451 to your computer and use it in GitHub Desktop.
| var lineLayer = L.geoJson().addTo(mapLayer.getMap()); | |
| lineLayer.options.style = function (feature) { | |
| var p = feature.properties || {}; | |
| return {color:p.color||"gray", weight:p.weight||2, opacity:0.5}; | |
| } | |
| var counter = 0; | |
| var timeLimit = 10 * 30; | |
| var Papa = require("papaparse"); | |
| Papa.parse("http://127.0.0.1:8989/spt?point=51.351201,12.398071&time_limit="+timeLimit+"&columns=prev_longitude,prev_latitude,longitude,latitude,time,road_environment", { | |
| download: true, | |
| worker: true, // the UI should stay reactive while downloading | |
| step: function(results) { | |
| var d = results.data; | |
| // the root node has null for the previous values and time==0 | |
| if(counter > 0 && d[4] > 0) { | |
| var properties = {}; | |
| if (d[5] === "tunnel") | |
| properties = {weight: 3, color: "red"}; | |
| else if(d[5] === "bridge") | |
| properties = {weight: 3, color: "orange"}; | |
| lineLayer.addData({type:"Feature",properties: properties,geometry:{type:"LineString",coordinates:[[d[0],d[1]],[d[2],d[3]]]}}); | |
| } | |
| counter++; | |
| }, | |
| complete: function() { | |
| console.log("All done for /spt! " + counter); | |
| } | |
| }); |
| var lineLayer = L.geoJson().addTo(mapLayer.getMap()); | |
| lineLayer.options.style = function (feature) { | |
| var p = feature.properties || {}; | |
| return {color:p.color||"gray", weight:p.weight||2, opacity:0.5}; | |
| } | |
| var counter = 0; | |
| var timeLimit = 10 * 30; | |
| var Papa = require("papaparse"); | |
| Papa.parse("http://127.0.0.1:8989/spt?point=52.321911,10.393066&time_limit="+timeLimit+"&columns=prev_longitude,prev_latitude,longitude,latitude,time", { | |
| download: true, | |
| worker: true, // the UI should stay reactive while downloading | |
| step: function(results) { | |
| var d = results.data; | |
| // the root node has null for the previous values and time==0 | |
| if(counter > 0 && d[4] > 0) { | |
| var r = d[4] / 1000.0 / timeLimit; | |
| // TODO can we avoid parsing the Color here? | |
| var colorStr = "rgb("+255 * (1 - r)+","+ 128 * r+","+ 255 * r+")"; | |
| lineLayer.addData({type:"Feature",properties:{color:colorStr},geometry:{type:"LineString",coordinates:[[d[0],d[1]],[d[2],d[3]]]}}); | |
| } | |
| counter++; | |
| }, | |
| complete: function() { | |
| console.log("All done for /spt! " + counter); | |
| } | |
| }); |
hi @karussell,
I am very new to GraphHopper and been experimenting with it for a week now. Pardon my ignorance if some of my questions seem silly.
I stumbled upon this snippet while trying out the https://github.com/graphhopper/isochrone-experiments repo where it mentions that the /spt endpoint merged with this graphhopper/graphhopper#1577 PR can do the job as well. However, I find the instructions here a bit confusing. I tried to follow them as closely as possible. Here are my steps:
- clone GH:
git clone https://github.com/graphhopper/graphhopper.git - goto
assetsdirectory:cd web/src/main/resources/assets/ - It says 'look in' the
assetsdirectory but not sure for what but I assumed it would bejsdirectory. - goto
jsdirectory:cd js - could not find
map-template.jsbut there is amain-template.jsso editing this. - the problem here is that in
map-template.jsfile we have twomapLayer.initMapline. - I took the second JS script given here
snippet.jsand put it under the firstmapLayer.initMapline and changed the coordinates to match my data. - go back to
webdirectory:cd ../../../../ - run
npm install papaparse
command output:
+ papaparse@5.3.0
updated 1 package and audited 373 packages in 3.934s
- run
npm run watch
command output:
> graphhopper-js-ui@1.0.0 watch /home/fazlerabbi37/fr37/projects/official/barikoi/graphhopper/web
> watchify src/main/resources/assets/js/main-template.js -o target/classes/assets/js/main.js --debug --verbose
5325262 bytes written to target/classes/assets/js/main.js (1.96 seconds) at 10:07:12 AM
and stays.
- Opening the UI with http://127.0.0.1:8989/maps/?point=&layer=Omniscale%20Dev shows site can't be reached.
Can you please point out what am I doing wrong?
Thank you!
Do you have GraphHopper server started at port 8989? See https://github.com/graphhopper/graphhopper#installation
First, thank you for your quick reply!
I ran GraphHopper with ./graphhopper.sh web data.osm.pbf and open UI it would show a normal GH web UI and didn't really know what to do from that point on to get the Isochrone map as we see in your example output for snippet.js.
I just tried instructions given here and ran java -Ddw.graphhopper.datareader.file=data.osm.pbf -jar *.jar server config-example.yml and the result is same.
Maybe I am making a foolish mistake?
Have not tried it for a long time but would be nice if we can get it working again :)
I think you already did everything correct. The npm run watch should trigger a new JS file with the snippet.js included in main-template.js (not map-template.js like I initially wrote)
I took the second JS script given here snippet.js and put it under the first mapLayer.initMap line and changed the coordinates to match my data.
Yes, the first occurance is correct.
What is also important is that the request in the snippet.js fits to the OSM data you have (data.osm.pbf). E.g. if you use berlin area you need to change the URL to a lat,lon inside this area, e.g.
"http://127.0.0.1:8989/spt?point=52.499504%2C13.386841&time_limit="+timeLimit+"&columns=prev_longitude,prev_latitude,longitude,latitude,time"
As a last try can you force refresh your browser?
Ah, ugly. When you start and install GraphHopper make sure you have the following lines in your config uncommented:
assets:
  overrides:
    /maps: web/target/classes/assets/
See the details here: https://github.com/graphhopper/graphhopper/blob/master/docs/core/quickstart-from-source.md#javascript
Ensure that web/target/classes/assets/js/main-template.js really contains the snippet.
I downloaded the berlin area pbf, changed config-example.yml to uncomment assets part and started GH in one terminal tab with java -Ddw.graphhopper.datareader.file=berlin-latest.osm.pbf -jar *.jar server config-example.yml and on another terminal tab I ran npm run watch. Then opened http://127.0.0.1:8989/maps/?point=&layer=Omniscale%20Dev in the browser and did 'Empty Cache and Hard Reload' but the result is unfortunately same.
Just to see that things are working I tried running:
curl "http://127.0.0.1:8989/spt?point=52.499504%2C13.386841&time_limit=300&columns=prev_longitude,prev_latitude,longitude,latitude,time"
And got output:
....
13.382525854912233,52.48659798845495,13.383154870193188,52.48702770070049,286942
13.414144070762635,52.49406738193484,13.41372087777527,52.493468355241454,268996
13.382409067058767,52.487009074248576,13.383833990629777,52.48738029943512,291317
which seems to be working? Any pointer as to where can I go from here?
Just to see that things are working I tried running:
👍
And did you apply the config change and restart GH? (Otherwise GH will not look on the file system and instead look inside the jar file where only outdated JS files are included)
And did you apply the config change and restart GH?
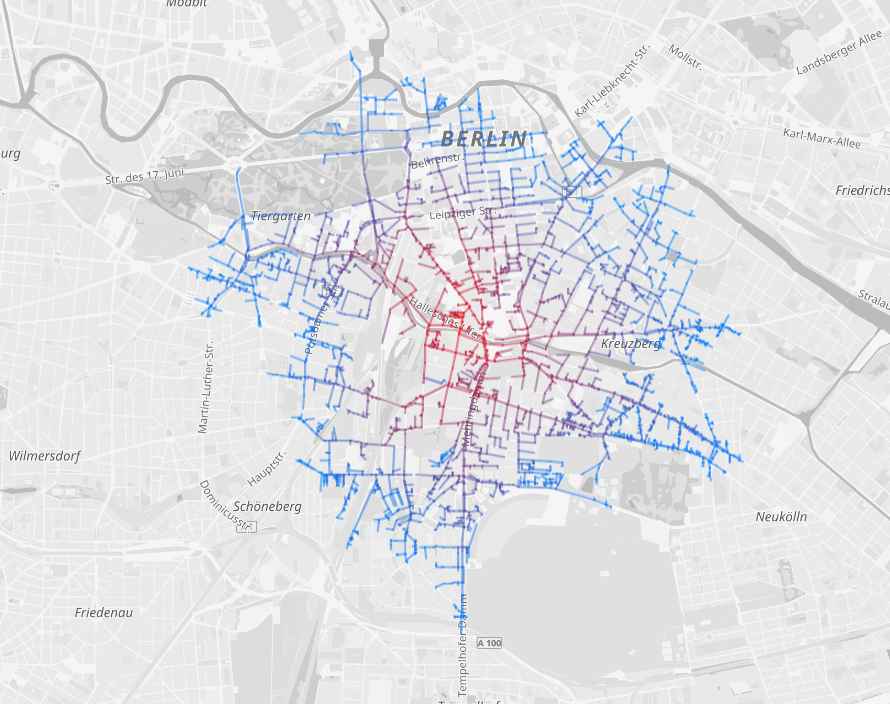
I think restarting GH did the trick! Thanks a ton! I can see the SPT graph.(is it even called an SPT graph!? would love to know the real term)
Anyway I would try it with a clean, new clone and redo the steps. Once I can reproduce the results I would share my steps there as well. Thank you for your help and for the awesome project! Cheers! 🎉
Yes, nice!
I would call it "SPT" (shortest path tree) which is a part of the whole graph, yes :)
Once I can reproduce the results I would share my steps there as well.
Thanks! In a newer version we plan to integrate this and/or make the integration of these special features easier.
With the help from @karussell, I have been able to create the SPT map. I have tested it with graphhopper/graphhopper@da16984.
Here are the steps. Start with GraphHopper repo clone and create a new branch:
git clone https://github.com/graphhopper/graphhopper.git
cd graphhopper
git checkout -b spt-exp
cp config-example.yml config.yml
Edit config.yml and uncomment the following:
assets:
  overrides:
    /maps: web/target/classes/assets/
Start the web server with your-area.pbf:
./graphhopper.sh web your-area.pbf
Open another terminal window and go to the same GraphHopper directory that we just clone and started the web server above. Now we will go to web directory:
cd web
edit main-template.js file inside web/src/main/resources/assets/:
Search for mapLayer.initMap and put snippet.js below the first occurrence and save the main-template.js file.
Now install papaparse and run server:
npm install papaparse
npm run watch
Open GraphHopper web UI at http://127.0.0.1:8989/maps/?point=&layer=Omniscale%20Dev to see the SPT map.
mapLayer.initMap...cd web && npm install papaparsenpm run watchExample output
snippet:
highlight tunnels: (this is probably better done via the new mvt layer)
Note
When you start and install GraphHopper make sure you have the following lines in your config uncommented: