-
-
Save karussell/a8203e66c4fea399d94189570be89451 to your computer and use it in GitHub Desktop.
| var lineLayer = L.geoJson().addTo(mapLayer.getMap()); | |
| lineLayer.options.style = function (feature) { | |
| var p = feature.properties || {}; | |
| return {color:p.color||"gray", weight:p.weight||2, opacity:0.5}; | |
| } | |
| var counter = 0; | |
| var timeLimit = 10 * 30; | |
| var Papa = require("papaparse"); | |
| Papa.parse("http://127.0.0.1:8989/spt?point=51.351201,12.398071&time_limit="+timeLimit+"&columns=prev_longitude,prev_latitude,longitude,latitude,time,road_environment", { | |
| download: true, | |
| worker: true, // the UI should stay reactive while downloading | |
| step: function(results) { | |
| var d = results.data; | |
| // the root node has null for the previous values and time==0 | |
| if(counter > 0 && d[4] > 0) { | |
| var properties = {}; | |
| if (d[5] === "tunnel") | |
| properties = {weight: 3, color: "red"}; | |
| else if(d[5] === "bridge") | |
| properties = {weight: 3, color: "orange"}; | |
| lineLayer.addData({type:"Feature",properties: properties,geometry:{type:"LineString",coordinates:[[d[0],d[1]],[d[2],d[3]]]}}); | |
| } | |
| counter++; | |
| }, | |
| complete: function() { | |
| console.log("All done for /spt! " + counter); | |
| } | |
| }); |
| var lineLayer = L.geoJson().addTo(mapLayer.getMap()); | |
| lineLayer.options.style = function (feature) { | |
| var p = feature.properties || {}; | |
| return {color:p.color||"gray", weight:p.weight||2, opacity:0.5}; | |
| } | |
| var counter = 0; | |
| var timeLimit = 10 * 30; | |
| var Papa = require("papaparse"); | |
| Papa.parse("http://127.0.0.1:8989/spt?point=52.321911,10.393066&time_limit="+timeLimit+"&columns=prev_longitude,prev_latitude,longitude,latitude,time", { | |
| download: true, | |
| worker: true, // the UI should stay reactive while downloading | |
| step: function(results) { | |
| var d = results.data; | |
| // the root node has null for the previous values and time==0 | |
| if(counter > 0 && d[4] > 0) { | |
| var r = d[4] / 1000.0 / timeLimit; | |
| // TODO can we avoid parsing the Color here? | |
| var colorStr = "rgb("+255 * (1 - r)+","+ 128 * r+","+ 255 * r+")"; | |
| lineLayer.addData({type:"Feature",properties:{color:colorStr},geometry:{type:"LineString",coordinates:[[d[0],d[1]],[d[2],d[3]]]}}); | |
| } | |
| counter++; | |
| }, | |
| complete: function() { | |
| console.log("All done for /spt! " + counter); | |
| } | |
| }); |
Just to see that things are working I tried running:
👍
And did you apply the config change and restart GH? (Otherwise GH will not look on the file system and instead look inside the jar file where only outdated JS files are included)
And did you apply the config change and restart GH?
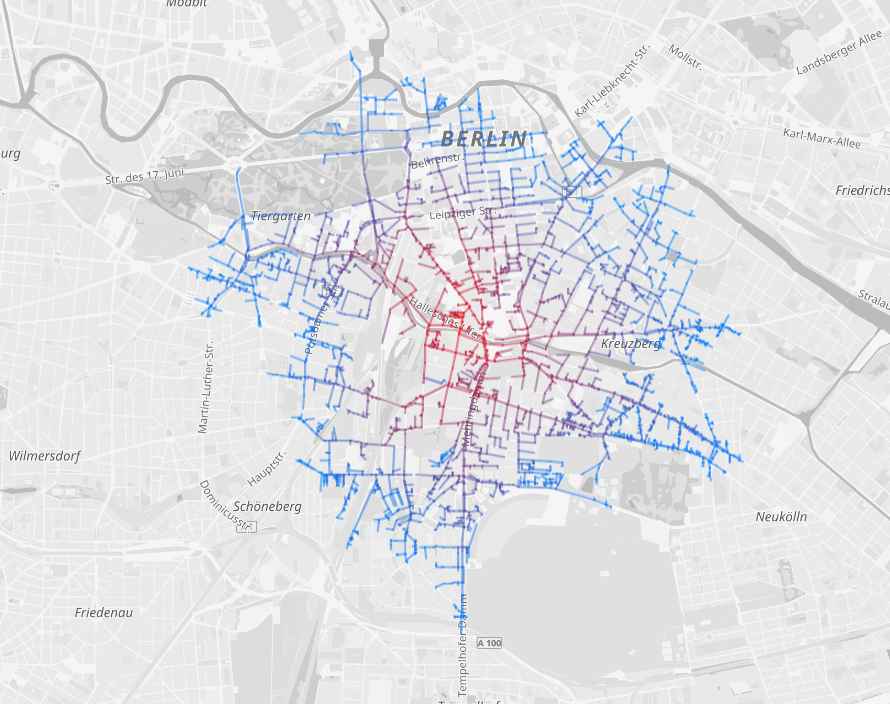
I think restarting GH did the trick! Thanks a ton! I can see the SPT graph.(is it even called an SPT graph!? would love to know the real term)
Anyway I would try it with a clean, new clone and redo the steps. Once I can reproduce the results I would share my steps there as well. Thank you for your help and for the awesome project! Cheers! 🎉
Yes, nice!
I would call it "SPT" (shortest path tree) which is a part of the whole graph, yes :)
Once I can reproduce the results I would share my steps there as well.
Thanks! In a newer version we plan to integrate this and/or make the integration of these special features easier.
With the help from @karussell, I have been able to create the SPT map. I have tested it with graphhopper/graphhopper@da16984.
Here are the steps. Start with GraphHopper repo clone and create a new branch:
git clone https://github.com/graphhopper/graphhopper.git
cd graphhopper
git checkout -b spt-exp
cp config-example.yml config.yml
Edit config.yml and uncomment the following:
assets:
  overrides:
    /maps: web/target/classes/assets/
Start the web server with your-area.pbf:
./graphhopper.sh web your-area.pbf
Open another terminal window and go to the same GraphHopper directory that we just clone and started the web server above. Now we will go to web directory:
cd web
edit main-template.js file inside web/src/main/resources/assets/:
Search for mapLayer.initMap and put snippet.js below the first occurrence and save the main-template.js file.
Now install papaparse and run server:
npm install papaparse
npm run watch
Open GraphHopper web UI at http://127.0.0.1:8989/maps/?point=&layer=Omniscale%20Dev to see the SPT map.
I downloaded the berlin area pbf, changed
config-example.ymlto uncommentassetspart and started GH in one terminal tab withjava -Ddw.graphhopper.datareader.file=berlin-latest.osm.pbf -jar *.jar server config-example.ymland on another terminal tab I rannpm run watch. Then opened http://127.0.0.1:8989/maps/?point=&layer=Omniscale%20Dev in the browser and did 'Empty Cache and Hard Reload' but the result is unfortunately same.Just to see that things are working I tried running:
curl "http://127.0.0.1:8989/spt?point=52.499504%2C13.386841&time_limit=300&columns=prev_longitude,prev_latitude,longitude,latitude,time"And got output:
which seems to be working? Any pointer as to where can I go from here?