Skip to content

Instantly share code, notes, and snippets.

View kcui23's full-sized avatar
:shipit:

Kai Cui kcui23

:shipit:
  • NKU -> UW-M
  • Madison
View GitHub Profile
@kcui23
kcui23 / STAT679 readings7-1.md
Last active November 1, 2023 20:47
Time Series Visualization (I)

Time Series Visualization (I)

Basic tasks and visual strategies for temporal data

Befor beginning

  • Be careful of variation across datasets and variation across tasks
  • Based on that, there have been several efforts to systematically taxonomize the types of queries that time series visualizations have been used for.
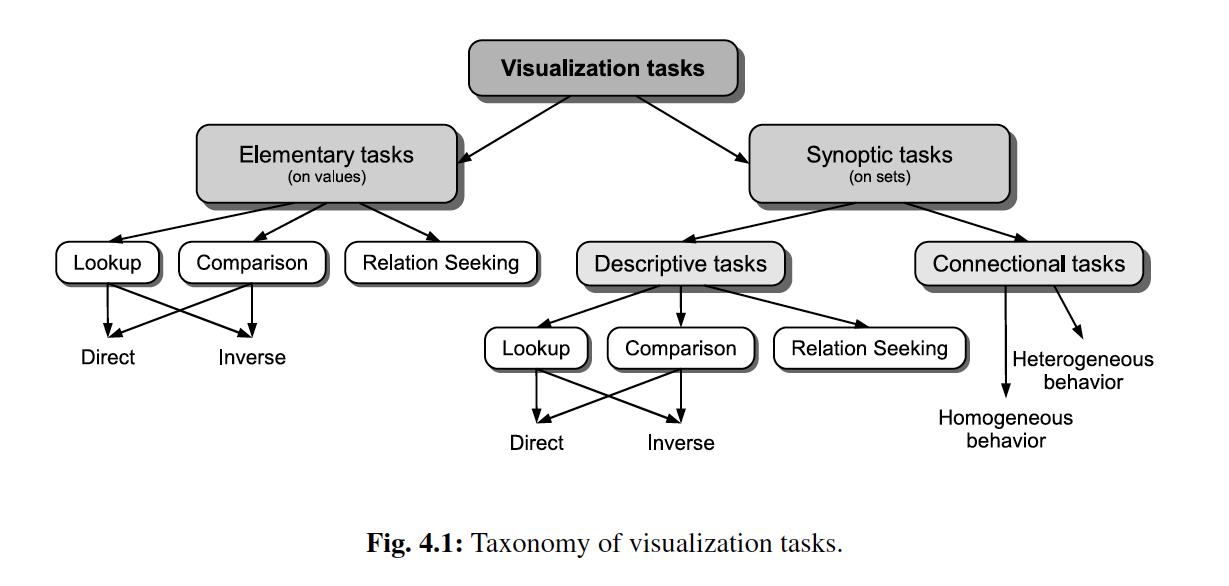
  • 1

Technical details

  • Human eyes good at catching information of lines: use geom_line() to create basic lines
  • It is useful to draw area plot to emphasize the fact that these are amounts (they must be nonnegative). e.g. trade volume: use geom_area() to create area plot
  • For a larger collection of time series: use group_by() and facet_wrap() or facet_grid() to create plots at the same time
@kcui23
kcui23 / STAT679 readings.md
Created September 17, 2023 17:52
STAT679 readings

Small Multiples and Faceting

Motivation:

  • want to show more variables or dimensions at the same time

Technical Details

  • we can use facet_grid or facet_wrap to do that
  • you can use different types of figure like scatterplot, line, barplot
  • you can use scale = “free_y” in facet function to allow different scales in different raws