Basic tasks and visual strategies for temporal data
- Be careful of variation across datasets and variation across tasks
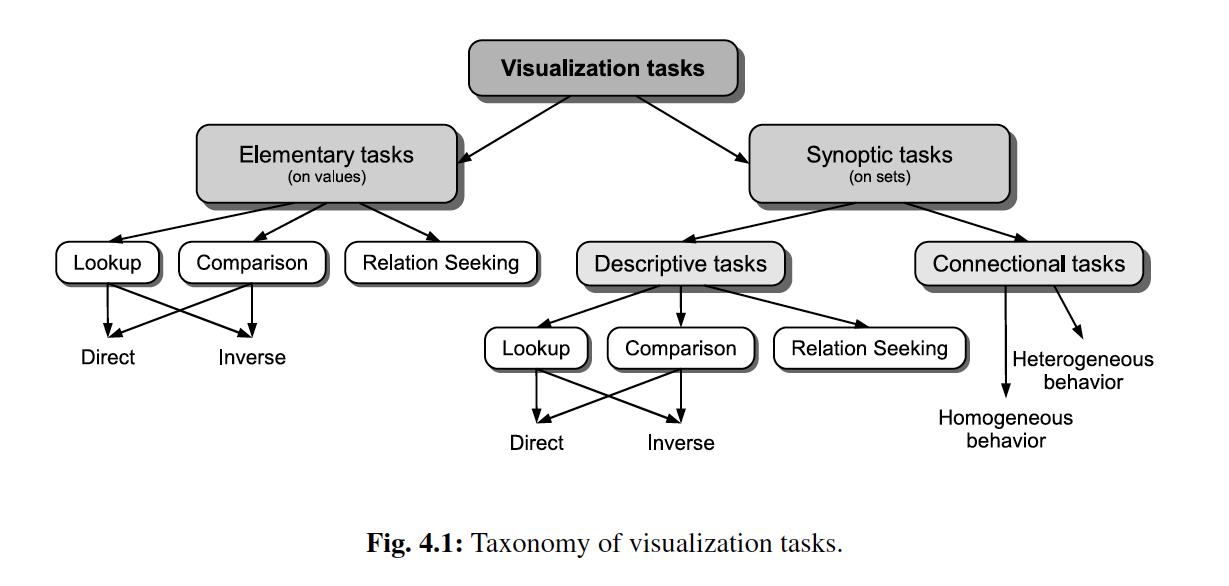
- Based on that, there have been several efforts to systematically taxonomize the types of queries that time series visualizations have been used for.
- Human eyes good at catching information of lines: use
geom_line()to create basic lines - It is useful to draw area plot to emphasize the fact that these are amounts (they must be nonnegative). e.g. trade volume: use
geom_area()to create area plot - For a larger collection of time series: use
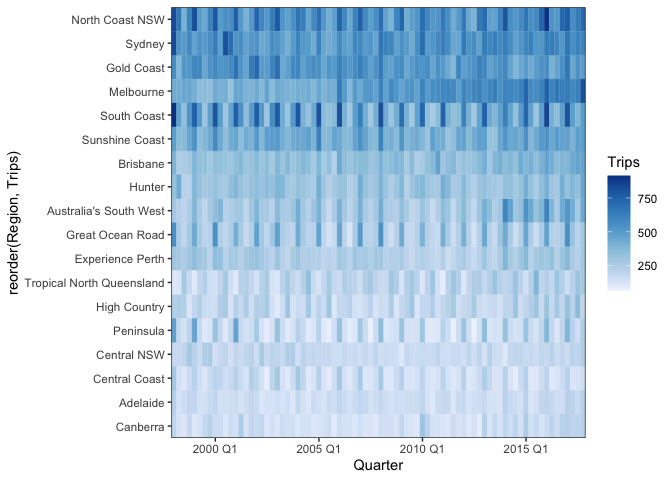
group_by()andfacet_wrap()orfacet_grid()to create plots at the same time - To clearly compare the y values of different sequences: use
geom_tile()to create heatmap