The QGIS attribute form currently allows displaying and editing the following things:
- Attribute editors (highly configurable)
- Relation editor (for showing children of a feature)
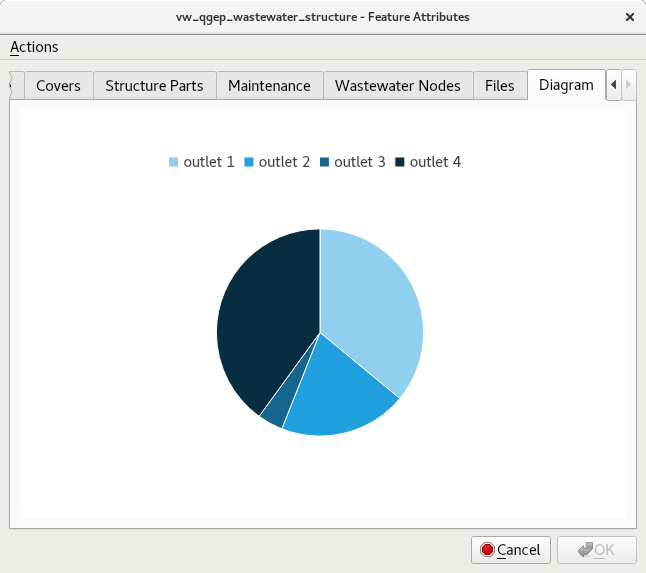
We propose to add a new widget type Charts and drawings Widget to this list. With this new type it will be possible to show graphically appealing and interactive items like charts or technical drawings on the attribute form.
QML is able to show complex shapes, integrate pictures from external sources and programmable with javascript for interactive applications. It's a bit like an HTML page on the attribute form but very well integrated with Qt.
The QML source code will be editable within the "Attributes Form" configuration on the layers properties page. The current feature's attribute values will be available within the QML view (in the example outlet_1 to outlet_4 are attributes).
import QtQuick 2.0
import QtCharts 2.0

ChartView {
    width: 600
    height: 400

    PieSeries {
        id: pieSeries
        PieSlice { label: "outlet 1"; value: attributes.outlet_1 }
        PieSlice { label: "outlet 2"; value: attributes.outlet_2 }
        PieSlice { label: "outlet 3"; value: attributes.outlet_3 }
        PieSlice { label: "outlet 4"; value: attributes.outlet_4 }
    }
}
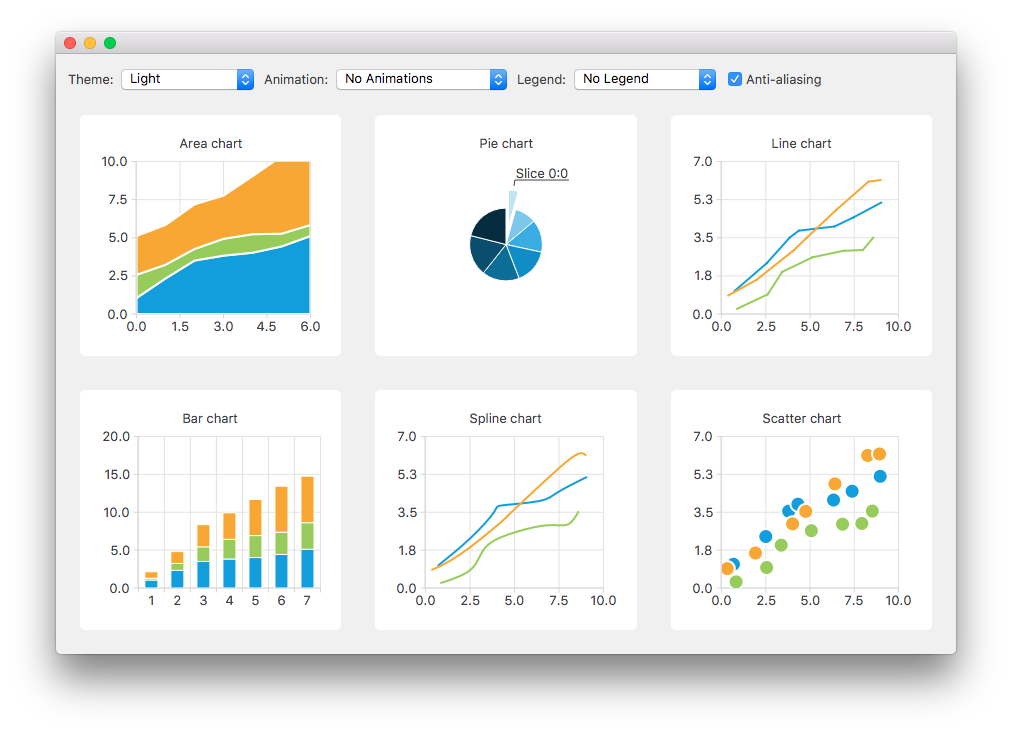
For more impressions on what's possible with see the QtCharts documentation and the QML documentation.
There will also be a wizard to generate the QML code for charts. It will allow selecting
- a chart type
- attributes to use as input values
- a style
- potentially other visual properties like showing the legend or not
As an example, in wastewater management, there is a known topology below the surface. Pipes which are connected to manholes, visible on the street as covers. For engineers, having information about the structure visible and ready to explore in an intuitive way is very useful.


The concept is very flexible. It's possible to add
- information in scatterplots
- information in bar charts
- horizontal or vertical sketches
- mouse interaction
- animations.
In a first version it will not be possible to edit attributes and save them back to the layer within the QML view. This can as usual still be done in attribute editors which are shown next to the QML view.
We have very experienced and active QGIS developers employed at OPENGIS.ch. In particular the following past projects make us the perfect candidate for this project
- Implementation of the current widget system and relation system for attribute forms
- Implementation of QField which is completely based on QML and a complex interactive application
- If the proposal is accepted, this will be implemented for QGIS 3.4 LTR.
Regarding attributes I could not find an automated function to add attributes to a
QQuickWidget. So should we generate and add to the source-file kind of the following code?