-
-
Save marcusraitner/a1b633625d1016498eaaab712461dfc4 to your computer and use it in GitHub Desktop.
| // Variables used by Scriptable. | |
| // These must be at the very top of the file. Do not edit. | |
| // icon-color: deep-gray; icon-glyph: magic; | |
| // Licence: GNU GENERAL PUBLIC LICENSE, Version 3, 29 June 2007 | |
| // Author: Marcus Raitner (https://fuehrung-erfahren.de) | |
| // Source: https://github.com/marcusraitner/COVID-19-Dashboard | |
| // ## Changelog | |
| // * 1.0.1: Correction of layout of label for covid-beds | |
| // * 1.0.2: Bug-Fix for Saar-Pfalz-Kreis (using GEN instead of county for join) | |
| // * 1.0.3: Bug-Fix for Landsberg a. Lech (now using both GEN and county) | |
| // * 1.0.4: Bug-Fix. Now using AGS for join (county and GEN only as backup) | |
| // * 1.1.0: New API for vaccinations | |
| // * 1.2.0: New colors and a new step for incidence 165 | |
| // * 1.3.0: New feature: Show also incidence for Germany with "showGermanyValue = true" | |
| // * 1.4.0: New feature: R-Value for Germany. Bugfix for date of incidence | |
| // * 1.5.0: Handling of parameters enhanced; see README for full reference | |
| // * 1.6.0: New feature: Use frozen values of RKI | |
| // * 1.7.0: New feature: Show one decimal (optional); improved rounding; minor visual improvements. | |
| // * 1.8.0: Complete redesign of incidence graph and some minor adjustments | |
| // * 1.9.0: Themes and new parameter bl | |
| // * 1.10.0: Added hospitalization | |
| // * 1.10.1: Added toggle for hospitalization | |
| // * 1.10.2: New color in RKI Theme for incidence > 1.000 (and color for 500 adjusted to RKI Dashboard) | |
| // * 1.10.3: Some minor display adjustments | |
| // * 1.11.0: Booster quote | |
| const version = "1.11.0" | |
| //------------------------------------------------------------------------------ | |
| // General Options Section | |
| //------------------------------------------------------------------------------ | |
| // Set to true for debugging information in the console | |
| const debug = false; | |
| // Set to true for an image background, false for no image. | |
| const imageBackground = false; | |
| // Set to true to reset the widget's background image. | |
| const forceImageUpdate = false; | |
| // Show also the incidence for Germany in total | |
| var showGermanyValue = false; | |
| // Show also the R-Value (only if showGermanyValue == true) | |
| var showRValue = true; | |
| // Toggle showing of vaccination status | |
| var showVaccination = true; | |
| // Toggle showing of ICU beds | |
| var showIcu = true; | |
| // show daily portion of incidence | |
| var showDaily = true; | |
| // Show frozen value for incidence instead of calculating it. | |
| var useFrozen = false; | |
| // number of days to show in detail | |
| var detail = 5; | |
| // show values for the state | |
| var showBl = true; | |
| // The color theme | |
| var theme = "original"; | |
| // Show Hospitalization | |
| var showHospitalization = true; | |
| // palette found here: https://coolors.co/03071e-370617-6a040f-9d0208-d00000-dc2f02-e85d04-f48c06-faa307-ffba08 | |
| const incidenceColors = { | |
| original: [{ | |
| lower: 0, | |
| color: new Color('#b1a7a6', 1), | |
| highlight: new Color("#FFFFFF", .7) | |
| }, | |
| { | |
| lower: 35, | |
| color: new Color('#F48C06', 1), | |
| highlight: new Color("#FFFFFF", .7) | |
| }, | |
| { | |
| lower: 50, | |
| color: new Color('#E85D04', 1), | |
| highlight: new Color("#FFFFFF", .7) | |
| }, | |
| { | |
| lower: 100, | |
| color: new Color('#D00000', 1), | |
| highlight: new Color("#FFFFFF", .7) | |
| }, | |
| { | |
| lower: 165, | |
| color: new Color('#6A040F', 1), | |
| highlight: new Color("#FFFFFF", .7) | |
| }, | |
| { | |
| lower: 200, | |
| color: new Color('#370617', 1), | |
| highlight: new Color("#FFFFFF", .7) | |
| } | |
| ], | |
| rki: [{ | |
| lower: 0, | |
| color: new Color('#ffffff', 1), | |
| highlight: new Color('#000000', .5) | |
| }, | |
| { | |
| lower: 5, | |
| color: new Color('#fcf39f', 1), | |
| highlight: new Color('#000000', .5) | |
| }, | |
| { | |
| lower: 25, | |
| color: new Color('#f9af4d', 1), | |
| highlight: new Color("#FFFFFF", .7) | |
| }, | |
| { | |
| lower: 50, | |
| color: new Color('#ff3d33', 1), | |
| highlight: new Color("#FFFFFF", .7) | |
| }, | |
| { | |
| lower: 100, | |
| color: new Color('#cc0a00', 1), | |
| highlight: new Color("#FFFFFF", .7) | |
| }, | |
| { | |
| lower: 250, | |
| color: new Color('#8c0801', 1), | |
| highlight: new Color("#FFFFFF", .7) | |
| }, | |
| { | |
| lower: 500, | |
| color: new Color('#C82B81', 1), | |
| highlight: new Color("#FFFFFF", .7) | |
| }, | |
| { | |
| lower: 1000, | |
| color: new Color('#6E1472', 1), | |
| highlight: new Color("#FFFFFF", .7) | |
| } | |
| ] | |
| }; | |
| // colors for covid beds highlighting | |
| const colorCovidBed = new Color('#DC2F02', 1); | |
| const colorCovidBedVentilation = new Color('#9D0208', 1); | |
| const bedsLineColor = new Color('#b1a7a6', 1); | |
| const bedsLineFreeColor = new Color('#4D8802', 1); | |
| // other colors | |
| const accentColor2 = Color.lightGray(); // used for weekends | |
| const vaccinationColor = new Color('#00848C', 1); | |
| const vaccinationSecondColor = new Color('#004156', 1); | |
| const vaccinationBoosterColor = new Color('#45b08c', 1); | |
| // Gradients | |
| let vaccinationGradient = new LinearGradient(); | |
| vaccinationGradient.locations = [0, 0.2, 0.8, 1]; | |
| vaccinationGradient.colors = [ | |
| new Color('#8C8C8C', 1), | |
| new Color('#535353', 1), | |
| new Color('#535353', 1), | |
| new Color('#8C8C8C', 1) | |
| ]; | |
| let backgroundGradient = new LinearGradient(); | |
| backgroundGradient.locations = [0, 0.2, 0.8, 1]; | |
| backgroundGradient.colors = [ | |
| new Color("#28416F"), | |
| new Color("#141E30"), | |
| new Color("#141E30"), | |
| new Color("#28416F") | |
| ]; | |
| //------------------------------------------------------------------------------ | |
| const DAY_IN_MICROSECONDS = 86400000; | |
| const widgetHeight = 338; | |
| const widgetWidth = 720; | |
| const graphLow = 0; | |
| var graphHeight = 175; | |
| var graphWidth = widgetWidth; | |
| const bedsHeight = 80; | |
| var bedsWidth = graphWidth; | |
| const bedsLineWidth = 12; | |
| const tickWidth = 4; | |
| const vaccinationWidth = 65; | |
| const hospitalizationWidth = 65; | |
| const hospitalizationHeight = 80; | |
| const smallSpace = 12; | |
| const gap = 3; | |
| var spaceBetweenDays = smallSpace * 5; | |
| var vertLineWeight = spaceBetweenDays - gap; | |
| const smallLineWeight = smallSpace - gap; | |
| // APIs | |
| const apiUrl = (location) => `https://services7.arcgis.com/mOBPykOjAyBO2ZKk/arcgis/rest/services/RKI_Landkreisdaten/FeatureServer/0/query?where=1%3D1&outFields=GEN,AGS,EWZ,EWZ_BL,cases,death_rate,deaths,cases7_per_100k,cases7_bl_per_100k,BL,county&geometry=${ location.longitude.toFixed( 3 ) }%2C${ location.latitude.toFixed( 3 ) }&geometryType=esriGeometryPoint&inSR=4326&spatialRel=esriSpatialRelWithin&returnGeometry=false&outSR=4326&f=json`; | |
| const apiUrlData = (county, minDate) => `https://services7.arcgis.com/mOBPykOjAyBO2ZKk/arcgis/rest/services/Covid19_RKI_Sums/FeatureServer/0/query?where=Landkreis+LIKE+%27%25${ encodeURIComponent( county ) }%25%27+AND+Meldedatum+%3E+%27${ encodeURIComponent( minDate ) }%27&objectIds=&time=&resultType=none&outFields=*&returnIdsOnly=false&returnUniqueIdsOnly=false&returnCountOnly=false&returnDistinctValues=false&cacheHint=false&orderByFields=Meldedatum&groupByFieldsForStatistics=&outStatistics=&having=&resultOffset=&resultRecordCount=&sqlFormat=none&f=json&token=`; | |
| const apiUrlData2 = (ags, minDate) => `https://services7.arcgis.com/mOBPykOjAyBO2ZKk/arcgis/rest/services/Covid19_RKI_Sums/FeatureServer/0/query?where=idLandkreis%3D+${ encodeURIComponent( ags ) }+AND+Meldedatum+%3E+%27${ encodeURIComponent( minDate ) }%27&objectIds=&time=&resultType=none&outFields=*&returnIdsOnly=false&returnUniqueIdsOnly=false&returnCountOnly=false&returnDistinctValues=false&cacheHint=false&orderByFields=Meldedatum&groupByFieldsForStatistics=&outStatistics=&having=&resultOffset=&resultRecordCount=&sqlFormat=none&f=json&token=`; | |
| const diviApiUrl = (location) => `https://services7.arcgis.com/mOBPykOjAyBO2ZKk/arcgis/rest/services/DIVI_Intensivregister_Landkreise/FeatureServer/0/query?where=1%3D1&outFields=*&geometry=${ location.longitude.toFixed( 3 ) }%2C${ location.latitude.toFixed( 3 ) }&geometryType=esriGeometryPoint&inSR=4326&spatialRel=esriSpatialRelWithin&returnGeometry=false&outSR=4326&f=json`; | |
| const vaccUrl = `https://api.corona-zahlen.org/vaccinations`; | |
| const germanyUrl = `https://api.corona-zahlen.org/germany`; | |
| const apiUrlDistricts = `https://api.corona-zahlen.org/districts/`; | |
| const apiUrlHospitalization = `https://api.corona-zahlen.org/states`; | |
| const apiUrlDataFrozen = (ags, days) => `https://api.corona-zahlen.org/districts/${ encodeURIComponent( ags ) }/history/frozen-incidence/${ encodeURIComponent( days ) }`; | |
| const stateToAbbr = { | |
| 'Baden-Württemberg': 'BW', | |
| 'Bayern': 'BY', | |
| 'Berlin': 'BE', | |
| 'Brandenburg': 'BB', | |
| 'Bremen': 'HB', | |
| 'Hamburg': 'HH', | |
| 'Hessen': 'HE', | |
| 'Mecklenburg-Vorpommern': 'MV', | |
| 'Niedersachsen': 'NI', | |
| 'Nordrhein-Westfalen': 'NW', | |
| 'Rheinland-Pfalz': 'RP', | |
| 'Saarland': 'SL', | |
| 'Sachsen': 'SN', | |
| 'Sachsen-Anhalt': 'ST', | |
| 'Schleswig-Holstein': 'SH', | |
| 'Thüringen': 'TH' | |
| }; | |
| const rulesUrl = { | |
| 'Baden-Württemberg': 'https://www.baden-wuerttemberg.de/de/service/aktuelle-infos-zu-corona/', | |
| 'Bayern': 'https://www.bayern.de/coronavirus-in-bayern-informationen-auf-einen-blick/', | |
| 'Berlin': 'https://www.berlin.de/corona/', | |
| 'Brandenburg': 'https://kkm.brandenburg.de/kkm/de/', | |
| 'Bremen': 'https://www.bremen.de/corona', | |
| 'Hamburg': 'https://www.hamburg.de/coronavirus/', | |
| 'Hessen': 'https://www.hessen.de/fuer-buerger/aktuelle-informationen-zu-corona-hessen', | |
| 'Mecklenburg-Vorpommern': 'https://www.regierung-mv.de/corona/', | |
| 'Niedersachsen': 'https://www.niedersachsen.de/Coronavirus', | |
| 'Nordrhein-Westfalen': 'https://www.land.nrw/corona', | |
| 'Rheinland-Pfalz': 'https://corona.rlp.de/de/startseite/', | |
| 'Saarland': 'https://corona.saarland.de/DE/home/home_node.html', | |
| 'Sachsen': 'https://www.coronavirus.sachsen.de/index.html', | |
| 'Sachsen-Anhalt': 'https://coronavirus.sachsen-anhalt.de/', | |
| 'Schleswig-Holstein': 'https://www.schleswig-holstein.de/DE/Schwerpunkte/Coronavirus/coronavirus_node.html;jsessionid=8651006488D177B24833E4A56502FC06.delivery1-master', | |
| 'Thüringen': 'https://corona.thueringen.de/' | |
| }; | |
| let widget = await createWidget(); | |
| await widget.presentMedium(); | |
| Script.setWidget(widget); | |
| Script.complete(); | |
| async function createWidget(items) { | |
| let location; | |
| const list = new ListWidget(); | |
| // If it's an image background, display it. | |
| if (imageBackground) { | |
| // Determine if our image exists and when it was saved. | |
| const files = FileManager.local() | |
| const path = files.joinPath(files.documentsDirectory(), "covid19-background-image") | |
| const exists = files.fileExists(path) | |
| // If it exists and an update isn't forced, use the cache. | |
| if (exists && (config.runsInWidget || !forceImageUpdate)) { | |
| list.backgroundImage = files.readImage(path) | |
| // If it's missing when running in the widget, use a gray background. | |
| } else if (!exists && config.runsInWidget) { | |
| list.backgroundGradient = backgroundGradient; | |
| // But if we're running in app, prompt the user for the image. | |
| } else { | |
| const img = await Photos.fromLibrary() | |
| list.backgroundImage = img | |
| files.writeImage(path, img) | |
| } | |
| // If it's not an image background, show the gradient. | |
| } else { | |
| list.backgroundGradient = backgroundGradient; | |
| } | |
| list.setPadding(0, 0, 0, 0); | |
| // Parse parameters | |
| if (args.widgetParameter) { | |
| const params = args.widgetParameter.split(';'); | |
| for (var i = 0; i < params.length; i++) { | |
| const p = params[i].split('='); | |
| if (p[0].trim().toLowerCase() == "loc") { | |
| const fixedCoordinates = p[1].split(',').map(parseFloat); | |
| location = { | |
| latitude: fixedCoordinates[0], | |
| longitude: fixedCoordinates[1] | |
| }; | |
| } else if (p[0].trim().toLowerCase() == "de") { | |
| if (p[1].trim().toLowerCase() == "y") { | |
| showGermanyValue = true; | |
| } else { | |
| showGermanyValue = false; | |
| } | |
| } else if (p[0].trim().toLowerCase() == "bl") { | |
| if (p[1].trim().toLowerCase() == "y") { | |
| showBl = true; | |
| } else { | |
| showBl = false; | |
| } | |
| } else if (p[0].trim().toLowerCase() == "rval") { | |
| if (p[1].trim().toLowerCase() == "y") { | |
| showRValue = true; | |
| } else { | |
| showRValue = false; | |
| } | |
| } else if (p[0].trim().toLowerCase() == "vac") { | |
| if (p[1].trim().toLowerCase() == "y") { | |
| showVaccination = true; | |
| } else { | |
| showVaccination = false; | |
| } | |
| } else if (p[0].trim().toLowerCase() == "beds") { | |
| if (p[1].trim().toLowerCase() == "y") { | |
| showIcu = true; | |
| } else { | |
| showIcu = false; | |
| } | |
| } else if (p[0].trim().toLowerCase() == "daily") { | |
| if (p[1].trim().toLowerCase() == "y") { | |
| showDaily = true; | |
| } else { | |
| showDaily = false; | |
| } | |
| } else if (p[0].trim().toLowerCase() == "frozen") { | |
| if (p[1].trim().toLowerCase() == "y") { | |
| useFrozen = true; | |
| } else { | |
| useFrozen = false; | |
| } | |
| } else if (p[0].trim().toLowerCase() == "theme") { | |
| if (p[1].trim().toLowerCase() == "rki") { | |
| theme = "rki"; | |
| } else { | |
| theme = "original"; | |
| } | |
| } else if (p[0].trim().toLowerCase() == "days") { | |
| const parsed = Number.parseInt(p[1].trim()); | |
| if (!Number.isNaN(parsed)) { | |
| detail = parsed; | |
| } | |
| } else if (p[0].trim().toLowerCase() == "hosp") { | |
| if (p[1].trim().toLowerCase() == "y") { | |
| showHospitalization = true; | |
| } else { | |
| showHospitalization = false; | |
| } | |
| } else if (p.length == 1) { | |
| // for compatability with old syntax | |
| const fixedCoordinates = p[0].split(',').map(parseFloat); | |
| location = { | |
| latitude: fixedCoordinates[0], | |
| longitude: fixedCoordinates[1] | |
| }; | |
| } | |
| } | |
| } | |
| // Adjust dimensions | |
| // get data for the last days | |
| var days = 18; | |
| if (showGermanyValue) { | |
| days -= 1; | |
| } | |
| if (showBl) { | |
| days -= 1; | |
| } | |
| if (showVaccination) { | |
| graphWidth = widgetWidth - vaccinationWidth - 10; | |
| days -= 1; | |
| } else { | |
| graphWidth = widgetWidth; | |
| } | |
| if (detail < 0) { | |
| detail = 0; | |
| } | |
| if (detail > days - 7) { | |
| detail = days - 7; | |
| } | |
| // calculate days for showing history | |
| days = (days - detail - 7) * (spaceBetweenDays / smallSpace) + detail + 9; | |
| if (!showBl && !showGermanyValue) { | |
| days += 2; | |
| } | |
| if (!showVaccination) { | |
| days += 1; | |
| } | |
| if (showIcu) { | |
| bedsWidth = graphWidth; | |
| } else { | |
| graphHeight += bedsHeight; | |
| } | |
| if (showHospitalization) { | |
| bedsWidth -= (hospitalizationWidth + 5); | |
| } | |
| if (!location) { | |
| Location.setAccuracyToThreeKilometers(); | |
| try { | |
| location = await Location.current(); | |
| if (debug) { | |
| console.log('get current lat/lon'); | |
| } | |
| } catch (e) { | |
| errorText = list.addText('Keine Ortsdaten gefunden'); | |
| errorText.textColor = Color.white(); | |
| return list; | |
| } | |
| } | |
| var germanyData = null; | |
| if (showGermanyValue) { | |
| if (debug) { | |
| console.log("Getting data for Germany: " + germanyUrl); | |
| } | |
| germanyData = await new Request(germanyUrl).loadJSON(); | |
| if (debug) { | |
| console.log(germanyData); | |
| } | |
| } | |
| if (debug) { | |
| console.log("Getting info for location: " + apiUrl(location)); | |
| } | |
| // get data for current location | |
| const locationData = await new Request(apiUrl(location)).loadJSON(); | |
| if (debug) { | |
| console.log(locationData); | |
| } | |
| if (!locationData || !locationData.features || !locationData.features.length) { | |
| errorText = list.addText('Keine Ergebnisse für den aktuellen Ort gefunden.'); | |
| errorText.textColor = Color.white(); | |
| console.log(locationData) | |
| return list; | |
| } | |
| const attr = locationData.features[0].attributes; | |
| // extract information needed | |
| const cityName = attr.GEN; // name of 'Landkreis' | |
| const ewz = attr.EWZ / 100000; // number of inhabitants | |
| const ewzBL = attr.EWZ_BL | |
| const county = attr.county; // Landkreis | |
| const gen = attr.GEN; | |
| var ags = attr.AGS; | |
| const bundesLand = stateToAbbr[attr.BL]; | |
| const bl = attr.BL; | |
| const incidenceBl = roundIncidence(attr.cases7_bl_per_100k); | |
| const latestIncidence = attr.cases7_per_100k; | |
| const date = new Date(); | |
| date.setTime(date.getTime() - days * DAY_IN_MICROSECONDS); | |
| const minDate = ('0' + (date.getMonth() + 1)).slice(-2) + '-' + ('0' + date.getDate()).slice(-2) + '-' + date.getFullYear(); | |
| let countyData; | |
| let updated; | |
| if (useFrozen) { | |
| if (!ags) { | |
| if (debug) { | |
| console.log("ags not set,looking it up with: " + apiUrlDistricts); | |
| } | |
| const districts = await new Request(apiUrlDistricts).loadJSON(); | |
| if (debug) { | |
| console.log(districts); | |
| } | |
| for (var district in districts.data) { | |
| if (districts.data[district].county == county) { | |
| ags = districts.data[district].ags; | |
| if (debug) { | |
| console.log("Found ags: " + ags); | |
| } | |
| break; | |
| } | |
| } | |
| } | |
| if (debug) { | |
| console.log("Getting frozen data for ags: " + apiUrlDataFrozen(ags, days)); | |
| } | |
| countyData = await new Request(apiUrlDataFrozen(ags, days - 7)).loadJSON(); | |
| if (debug) { | |
| console.log(countyData); | |
| } | |
| if (!countyData || !countyData.data || !countyData.data[ags].history || !countyData.data[ags].history.length) { | |
| list.addText('Keine Statistik gefunden.'); | |
| return list; | |
| } | |
| updated = new Date(countyData.meta.lastUpdate); | |
| } else { | |
| if (ags) { | |
| if (debug) { | |
| console.log("Getting data for ags: " + apiUrlData2(ags, minDate)); | |
| } | |
| countyData = await new Request(apiUrlData2(ags, minDate)).loadJSON(); | |
| if (debug) { | |
| console.log(countyData); | |
| } | |
| } else { | |
| if (debug) { | |
| console.log("Getting data for county: " + apiUrlData(gen, minDate)); | |
| } | |
| countyData = await new Request(apiUrlData(gen, minDate)).loadJSON(); | |
| if (debug) { | |
| console.log(countyData); | |
| } | |
| if (!countyData || !countyData.features || !countyData.features.length) { | |
| if (debug) { | |
| console.log("Getting data for county: " + apiUrlData(county, minDate)); | |
| } | |
| countyData = await new Request(apiUrlData(county, minDate)).loadJSON(); | |
| if (debug) { | |
| console.log(countyData); | |
| } | |
| } | |
| } | |
| if (!countyData || !countyData.features || !countyData.features.length) { | |
| list.addText('Keine Statistik gefunden.'); | |
| return list; | |
| } | |
| tmp = countyData.features[0].attributes.Datenstand.replace(" Uhr", "").split(","); | |
| tmpDate = tmp[0].split("."); | |
| tmpTime = tmp[1].split(":"); | |
| updated = new Date(tmpDate[2], tmpDate[1] - 1, tmpDate[0], tmpTime[0], tmpTime[1]); | |
| } | |
| let stack = list.addStack(); | |
| stack.layoutHorizontally(); | |
| stack.setPadding(0, 0, 0, 0); | |
| let leftStack = stack.addStack(); | |
| leftStack.layoutVertically(); | |
| let incidenceText = leftStack.addText('🦠 7-Tage-Inzidenz'.toUpperCase() + ' – ' + county); | |
| incidenceText.font = Font.semiboldRoundedSystemFont(11); | |
| incidenceText.textColor = Color.white(); | |
| incidenceText.url = rulesUrl[attr.BL]; | |
| if (showVaccination) { | |
| leftStack.addSpacer(5); | |
| if (debug) { | |
| console.log("Getting vaccination data: " + vaccUrl); | |
| } | |
| const vaccData = await new Request(vaccUrl).loadJSON(); | |
| if (debug) { | |
| console.log(vaccData); | |
| } | |
| if (!vaccData) { | |
| list.addText('Kein Impfstatus gefunden.'); | |
| return list; | |
| } | |
| let quoteInitial = Math.round(vaccData.data.states[bundesLand].quote * 100); | |
| let quoteSecond = Math.round(vaccData.data.states[bundesLand].secondVaccination.quote * 100); | |
| let quoteBooster = Math.round(vaccData.data.states[bundesLand].boosterVaccination.quote * 100); | |
| leftStack.setPadding(7, 7, 2, 0); | |
| stack.addSpacer(10); | |
| let rightStack = stack.addStack(); | |
| rightStack.setPadding(0, 0, 0, 0); | |
| rightStack.layoutVertically(); | |
| rightStack.backgroundGradient = vaccinationGradient; | |
| rightStack.cornerRadius = 4; | |
| // Add vaccination status | |
| const vaccinationHeight = widgetHeight - 10; | |
| const vaccinationBottom = vaccinationHeight; | |
| const vaccinationBarWidth = 20; | |
| let drawContext = new DrawContext(); | |
| drawContext.size = new Size(vaccinationWidth, vaccinationHeight); | |
| drawContext.opaque = false; | |
| let vaccinationTextRect = new Rect(10, 15, vaccinationWidth - 10, 55); | |
| drawTextR(drawContext, '💉', vaccinationTextRect, Color.white(), Font.mediumSystemFont(40)); | |
| vaccinationTextRect = new Rect(6, 5, vaccinationWidth - 10, 25); | |
| drawTextR(drawContext, bundesLand, vaccinationTextRect, Color.white(), Font.mediumSystemFont(22)); | |
| let vaccinationRect = new Rect(0, (1 - quoteInitial / 100) * vaccinationBottom, vaccinationWidth, vaccinationBottom * quoteInitial / 100); | |
| drawRoundedRect(drawContext, vaccinationRect, vaccinationColor, 4); | |
| vaccinationTextRect = new Rect(10, (1 - quoteInitial / 100) * vaccinationBottom - 26, vaccinationWidth, 22); | |
| drawTextR(drawContext, quoteInitial + ' %', vaccinationTextRect, Color.white(), Font.regularSystemFont(22)); | |
| let vaccinationSecondRect = new Rect(0, (1 - quoteSecond / 100) * vaccinationBottom, vaccinationWidth, vaccinationBottom * quoteSecond / 100); | |
| drawRoundedRect(drawContext, vaccinationSecondRect, vaccinationSecondColor, 4); | |
| vaccinationTextRect = new Rect(10, (1 - quoteSecond / 100) * vaccinationBottom, vaccinationWidth, 22); | |
| drawTextR(drawContext, quoteSecond + ' %', vaccinationTextRect, Color.white(), Font.regularSystemFont(22)); | |
| let vaccinationBoosterRect = new Rect(0, (1 - quoteBooster / 100) * vaccinationBottom, vaccinationWidth, vaccinationBottom * quoteBooster / 100); | |
| drawRoundedRect(drawContext, vaccinationBoosterRect, vaccinationBoosterColor, 4); | |
| vaccinationTextRect = new Rect(10, (1 - quoteBooster / 100) * vaccinationBottom, vaccinationWidth, 22); | |
| drawTextR(drawContext, quoteBooster + ' %', vaccinationTextRect, Color.white(), Font.regularSystemFont(22)); | |
| drawLine(drawContext, new Point(1, 0), new Point(1, vaccinationHeight), 2, Color.lightGray()); | |
| rightStack.addImage(drawContext.getImage()); | |
| } else { | |
| leftStack.setPadding(7, 7, 2, 7); | |
| } | |
| let min, max, diff; | |
| let dailyValues = new Array(); | |
| let history = new Array(); | |
| if (useFrozen) { | |
| history = countyData.data[ags].history; | |
| // add the latest incidence in case if we miss the value for today | |
| if (!isToday(new Date(history[history.length - 1].date))) { | |
| const today = { | |
| weekIncidence: latestIncidence, | |
| date: new Date() | |
| }; | |
| history.push(today); | |
| } | |
| } else { | |
| for (let i = countyData.features.length - 1; i >= 6; i--) { | |
| dailyValues[i - 6] = { | |
| abs: countyData.features[i].attributes.AnzahlFall, | |
| rel: countyData.features[i].attributes.AnzahlFall / ewz | |
| }; | |
| let sum = 0; | |
| for (let j = 0; j < 7; j++) { | |
| sum += countyData.features[i - j].attributes.AnzahlFall; | |
| } | |
| sum /= ewz; | |
| history[i - 6] = { | |
| weekIncidence: sum, | |
| date: countyData.features[i].attributes.Meldedatum | |
| }; | |
| } | |
| } | |
| for (let i = 0; i < history.length; i++) { | |
| history[i].weekIncidence = roundIncidence(history[i].weekIncidence); | |
| let aux = history[i].weekIncidence; | |
| max = (aux > max || max == undefined ? aux : max); | |
| } | |
| if (incidenceBl > max) { | |
| max = incidenceBl; | |
| } | |
| if (showGermanyValue && germanyData.weekIncidence > max) { | |
| max = germanyData.weekIncidence; | |
| } | |
| min = 0; | |
| diff = max - min; | |
| let graphDrawContext = new DrawContext(); | |
| graphDrawContext.size = new Size(graphWidth, graphHeight); | |
| graphDrawContext.opaque = false; | |
| graphDrawContext.setFont(Font.mediumSystemFont(20)); | |
| graphDrawContext.setTextAlignedCenter(); | |
| const graphTop = 23; | |
| const graphBottom = graphHeight - 23; | |
| const barHeight = graphBottom - graphTop; | |
| let dayColor; | |
| for (let i = 0; i < history.length; i++) { | |
| let date = new Date(history[i].date); | |
| if (!useFrozen) { | |
| date.setDate(date.getDate() + 1); | |
| } | |
| const day = date.getDate(); | |
| const dayOfWeek = date.getDay(); | |
| const cases = history[i].weekIncidence; | |
| const delta = (cases - min) / diff; | |
| let drawColor; | |
| let highlight; | |
| if (dayOfWeek == 0 || dayOfWeek == 6) { | |
| dayColor = accentColor2; | |
| } else { | |
| dayColor = Color.white(); | |
| } | |
| // Draw bar | |
| cols = getColor(cases); | |
| drawColor = cols.color; | |
| highlight = cols.highlight; | |
| let x0; | |
| let barWidth; | |
| if (i < history.length - detail) { | |
| x0 = smallSpace * i; | |
| barWidth = smallLineWeight; | |
| } else { | |
| x0 = smallSpace * (history.length - detail) + spaceBetweenDays * (i - history.length + detail); | |
| barWidth = vertLineWeight; | |
| } | |
| let rect = new Rect(x0, graphBottom - (barHeight * delta), barWidth, barHeight * delta); | |
| drawRoundedRect(graphDrawContext, rect, drawColor, 2); | |
| let y = graphBottom; | |
| // draw daily cases (if set) | |
| if (showDaily && !useFrozen && i < history.length - 1) { | |
| const dailyDelta = (dailyValues[i + 1].rel - min) / diff; | |
| y -= barHeight * dailyDelta; | |
| rect = new Rect(x0, y, barWidth, barHeight * dailyDelta); | |
| drawRoundedRect(graphDrawContext, rect, highlight, 2); | |
| if (i >= history.length - detail) { | |
| y -= 21; | |
| rect = new Rect(x0, y, barWidth, 20); | |
| drawTextR(graphDrawContext, "+" + dailyValues[i + 1].abs, rect, highlight, Font.mediumSystemFont(18)); | |
| } | |
| } | |
| // Draw labels | |
| if (i < history.length - detail) { | |
| if (dayOfWeek == 0 && i > 0 && i < history.length - detail - 1) { | |
| const dayRect = new Rect(x0 - smallSpace, graphBottom + 1, 3 * smallSpace, 23); | |
| drawTextR(graphDrawContext, day, dayRect, dayColor, Font.mediumSystemFont(20)); | |
| } | |
| } else { | |
| let y1 = graphBottom - (barHeight * delta) - 28 + 23; | |
| if (y1 > y) { | |
| y1 = y; | |
| } | |
| const casesRect = new Rect(x0, y1 - 23, barWidth, 23); | |
| drawTextR(graphDrawContext, formatIncidence(cases), casesRect, dayColor, Font.mediumSystemFont(20)); | |
| const dayRect = new Rect(x0, graphBottom + 1, barWidth, 23); | |
| drawTextR(graphDrawContext, day, dayRect, dayColor, Font.mediumSystemFont(20)); | |
| } | |
| } | |
| // Draw bar for Germany | |
| if (showGermanyValue) { | |
| germanyData.weekIncidence = roundIncidence(germanyData.weekIncidence); | |
| const delta = (germanyData.weekIncidence - min) / diff; | |
| const y = graphBottom - (barHeight * delta); | |
| const x = graphWidth - vertLineWeight; | |
| // draw rect in grey | |
| let rect = new Rect(x, y, vertLineWeight, barHeight * delta); | |
| drawRoundedRect(graphDrawContext, rect, new Color("#6c757d", 1), 2); | |
| // draw border in color of incidence | |
| drawColor = getColor(germanyData.weekIncidence).color; | |
| rect = new Rect(x + 2, y + 2, vertLineWeight - 4, barHeight * delta - 4); | |
| let path = new Path(); | |
| path.addRoundedRect(rect, 2, 2); | |
| graphDrawContext.addPath(path); | |
| graphDrawContext.setLineWidth(4); | |
| graphDrawContext.setStrokeColor(drawColor); | |
| graphDrawContext.strokePath(); | |
| // draw labels | |
| const bundesLandRect = new Rect(x, graphBottom - 28, vertLineWeight, 23); | |
| drawTextR(graphDrawContext, "DE", bundesLandRect, dayColor, Font.mediumSystemFont(20)); | |
| const bundesLandIncidenceRect = new Rect(x, y - 28, vertLineWeight, 23); | |
| drawTextR(graphDrawContext, formatIncidence(germanyData.weekIncidence), bundesLandIncidenceRect, dayColor, Font.mediumSystemFont(20)); | |
| // draw R-value (if set) | |
| if (showRValue) { | |
| let rRect = new Rect(x - 20, graphBottom + 1, vertLineWeight + 20, 23); | |
| drawTextR(graphDrawContext, "R:" + Intl.NumberFormat('de-DE', { | |
| minimumFractionDigits: 2 | |
| }).format(germanyData.r.rValue7Days.value), rRect, dayColor, Font.mediumSystemFont(20)); | |
| } | |
| } | |
| // Now draw the bar for the Bundesland | |
| if (showBl) { | |
| const delta = (incidenceBl - min) / diff; | |
| const y = graphBottom - (barHeight * delta); | |
| const x = (showGermanyValue ? graphWidth - vertLineWeight - spaceBetweenDays : graphWidth - vertLineWeight); | |
| // draw bar in grey | |
| let rect = new Rect(x, y, vertLineWeight, barHeight * delta); | |
| drawRoundedRect(graphDrawContext, rect, new Color("#343a40", 1), 2); | |
| // draw border in color of incidence | |
| drawColor = getColor(incidenceBl).color; | |
| rect = new Rect(x + 2, y + 2, vertLineWeight - 4, barHeight * delta - 4); | |
| path = new Path(); | |
| path.addRoundedRect(rect, 2, 2); | |
| graphDrawContext.addPath(path); | |
| graphDrawContext.setLineWidth(4); | |
| graphDrawContext.setStrokeColor(drawColor); | |
| graphDrawContext.strokePath(); | |
| // Draw labels | |
| const bundesLandRect = new Rect(x, graphBottom - 28, vertLineWeight, 23); | |
| drawTextR(graphDrawContext, bundesLand, bundesLandRect, dayColor, Font.mediumSystemFont(20)); | |
| const bundesLandIncidenceRect = new Rect(x, y - 28, vertLineWeight, 23); | |
| drawTextR(graphDrawContext, formatIncidence(incidenceBl), bundesLandIncidenceRect, dayColor, Font.mediumSystemFont(20)); | |
| } | |
| let graphImage = graphDrawContext.getImage(); | |
| leftStack.addImage(graphImage); | |
| leftStack.addSpacer(5); | |
| // Show ICU beds | |
| if (showIcu) { | |
| // Get data for icu beds | |
| if (debug) { | |
| console.log("Getting DIVI info for location: " + diviApiUrl(location)); | |
| } | |
| // get data for ICU beds of current location | |
| const diviLocationData = await new Request(diviApiUrl(location)).loadJSON(); | |
| if (debug) { | |
| console.log(diviLocationData); | |
| } | |
| if (!diviLocationData || !diviLocationData.features || !diviLocationData.features.length) { | |
| errorText = list.addText('Keine DIVI-Ergebnisse für den aktuellen Ort gefunden.'); | |
| errorText.textColor = Color.white(); | |
| console.log(diviLocationData); | |
| return list; | |
| } | |
| const diviAttr = diviLocationData.features[0].attributes; | |
| // extract data needed | |
| const freeBeds = (!diviAttr.betten_frei ? 0 : diviAttr.betten_frei); | |
| const beds = (!diviAttr.betten_gesamt ? 0 : diviAttr.betten_gesamt); | |
| const usedBeds = (!diviAttr.betten_belegt ? 0 : diviAttr.betten_belegt); | |
| const cases = (!diviAttr.faelle_covid_aktuell ? 0 : diviAttr.faelle_covid_aktuell); | |
| const casesBeatmet = (!diviAttr.faelle_covid_aktuell_beatmet ? 0 : diviAttr.faelle_covid_aktuell_beatmet); | |
| drawContext = new DrawContext(); | |
| drawContext.size = new Size(graphWidth, bedsHeight); | |
| drawContext.opaque = false; | |
| let freeBedsWidth = freeBeds / beds * bedsWidth; | |
| let covidBedsWidth = cases / beds * bedsWidth; | |
| let beatmetBedsWidth = casesBeatmet / beds * bedsWidth; | |
| freeBedsWidth = (!freeBedsWidth ? tickWidth / 2 : freeBedsWidth); | |
| covidBedsWidth = (!covidBedsWidth ? tickWidth / 2 : covidBedsWidth); | |
| beatmetBedsWidth = (!beatmetBedsWidth ? tickWidth / 2 : beatmetBedsWidth); | |
| // Line representing all beds | |
| let bedsLineRect = new Rect(0, bedsHeight / 2 - bedsLineWidth / 2, bedsWidth, bedsLineWidth); | |
| drawRoundedRect(drawContext, bedsLineRect, bedsLineColor, 2) | |
| let bedsRect = new Rect(0, bedsHeight / 2 - 40, bedsWidth - freeBedsWidth - 10, 26); | |
| drawContext.setFont(Font.mediumSystemFont(22)); | |
| drawContext.setTextColor(Color.white()); | |
| drawContext.drawTextInRect('🛏' + 'Intensivbetten'.toUpperCase() + ': ' + beds, bedsRect) | |
| // Portion representing free beds | |
| bedsLineRect = new Rect(bedsWidth - freeBedsWidth, bedsHeight / 2 - bedsLineWidth / 2, freeBedsWidth, bedsLineWidth); | |
| drawRoundedRect(drawContext, bedsLineRect, bedsLineFreeColor, 2); | |
| drawLine(drawContext, new Point(bedsWidth - freeBedsWidth, bedsHeight / 2 + bedsLineWidth / 2 + 5), new Point(bedsWidth - freeBedsWidth, bedsHeight / 2 - 40), tickWidth, new Color('#4D8802', 1)); | |
| drawContext.setFont(Font.mediumSystemFont(22)); | |
| let freeRect = new Rect(0, bedsHeight / 2 - 35, bedsWidth - freeBedsWidth - 10, 22); | |
| drawContext.setTextAlignedRight(); | |
| if (freeBedsWidth > bedsWidth / 2) { | |
| freeRect = new Rect(bedsWidth - freeBedsWidth + 10, bedsHeight / 2 - 35, freeBedsWidth - 10, 22); | |
| drawContext.setTextAlignedLeft(); | |
| } | |
| drawContext.drawTextInRect('frei'.toUpperCase() + ': ' + freeBeds, freeRect) | |
| // Portion representing covid patients | |
| bedsLineRect = new Rect(0, bedsHeight / 2 - bedsLineWidth / 2, covidBedsWidth, bedsLineWidth); | |
| drawRoundedRect(drawContext, bedsLineRect, colorCovidBed, 2); | |
| drawLine(drawContext, new Point(covidBedsWidth, bedsHeight / 2 - bedsLineWidth / 2 - 5), new Point(covidBedsWidth, bedsHeight / 2 + 38), tickWidth, colorCovidBed); | |
| // Portion representing cases beatmet | |
| bedsLineRect = new Rect(0, bedsHeight / 2 - bedsLineWidth / 2, beatmetBedsWidth, bedsLineWidth); | |
| drawRoundedRect(drawContext, bedsLineRect, colorCovidBedVentilation, 2); | |
| drawLine(drawContext, new Point(beatmetBedsWidth, bedsHeight / 2 - bedsLineWidth / 2 - 5), new Point(beatmetBedsWidth, bedsHeight / 2 + 20), tickWidth, colorCovidBedVentilation); | |
| let covidRect = new Rect(covidBedsWidth + 10, bedsHeight / 2 + 10, bedsWidth - covidBedsWidth - 10, 22); | |
| drawContext.setTextAlignedLeft(); | |
| if (covidBedsWidth > bedsWidth / 2) { | |
| covidRect = new Rect(0, bedsHeight / 2 + 10, covidBedsWidth - 10, 22); | |
| drawContext.setTextAlignedRight(); | |
| } | |
| let c19Label = '🦠C19: ' + cases; | |
| if (cases > 0) { | |
| c19Label = c19Label + ' (davon ' + casesBeatmet + ' beatmet)' | |
| } | |
| drawContext.drawTextInRect(c19Label, covidRect); | |
| // Get hospitalization Datenstand | |
| if (showHospitalization) { | |
| if (debug) { | |
| console.log("Getting hospitalization data: " + apiUrlHospitalization); | |
| } | |
| const hospitalizationData = await new Request(apiUrlHospitalization).loadJSON(); | |
| if (debug) { | |
| console.log(hospitalizationData); | |
| } | |
| if (!hospitalizationData) { | |
| list.addText('Keine Hospitalisierungsdaten.'); | |
| return list; | |
| } | |
| let hospitalizationCases7Days = hospitalizationData.data[bundesLand].hospitalization.cases7Days; | |
| let hospitalizationIncidence7Days = hospitalizationData.data[bundesLand].hospitalization.incidence7Days; | |
| let offset = bedsWidth + 5; | |
| let hospitalizationRect = new Rect(offset, 0, hospitalizationWidth, hospitalizationHeight); | |
| drawRoundedRect(drawContext, hospitalizationRect, new Color('#CBAE11'), 4); | |
| let hospitalizationTextRect = new Rect(offset + 5, 3, hospitalizationWidth - 10, 22); | |
| drawContext.setTextAlignedCenter(); | |
| drawTextR(drawContext, Intl.NumberFormat('de-DE', { | |
| minimumFractionDigits: 2 | |
| }).format(hospitalizationIncidence7Days), hospitalizationTextRect, Color.white(), Font.mediumSystemFont(22)); | |
| hospitalizationTextRect = new Rect(offset + 5, 28, hospitalizationWidth - 10, 22); | |
| drawContext.setTextAlignedCenter(); | |
| drawTextR(drawContext, hospitalizationCases7Days, hospitalizationTextRect, Color.white(), Font.mediumSystemFont(22)); | |
| hospitalizationTextRect = new Rect(offset + 5, 53, hospitalizationWidth - 10, 40); | |
| // drawContext.setTextAlignedLeft(); | |
| drawTextR(drawContext, '🏥' + bundesLand, hospitalizationTextRect, Color.white(), Font.mediumSystemFont(22)); | |
| } | |
| leftStack.addImage(drawContext.getImage()); | |
| } | |
| // leftStack.addSpacer(3); | |
| let statusStack = leftStack.addStack(); | |
| statusStack.layoutHorizontally(); | |
| statusStack.setPadding(0, 0, 0, 0); | |
| // statusStack.addSpacer(); | |
| let statusText = statusStack.addText("Datenstand: " + new Intl.DateTimeFormat('de-DE', { | |
| year: 'numeric', | |
| month: 'numeric', | |
| day: 'numeric', | |
| hour: 'numeric', | |
| minute: 'numeric' | |
| }).format(updated) + " // Version: " + version); | |
| statusText.font = Font.lightSystemFont(8); | |
| statusText.textColor = Color.gray(); | |
| if (!showVaccination) { | |
| statusStack.addSpacer(); | |
| } | |
| return list; | |
| } | |
| function drawTextR(drawContext, text, rect, color, font) { | |
| drawContext.setFont(font); | |
| drawContext.setTextColor(color); | |
| drawContext.drawTextInRect(new String(text).toString(), rect); | |
| } | |
| function drawLine(drawContext, point1, point2, width, color) { | |
| const path = new Path(); | |
| path.move(point1); | |
| path.addLine(point2); | |
| drawContext.addPath(path); | |
| drawContext.setStrokeColor(color); | |
| drawContext.setLineWidth(width); | |
| drawContext.strokePath(); | |
| } | |
| function drawRoundedRect(drawContext, rect, color, radius) { | |
| const path = new Path(); | |
| path.addRoundedRect(rect, radius, radius); | |
| drawContext.addPath(path); | |
| drawContext.setFillColor(color); | |
| drawContext.fillPath(); | |
| } | |
| function getColor(value) { | |
| let colors = incidenceColors[theme]; | |
| let i; | |
| for (i = 1; i < colors.length && colors[i].lower <= value; i++) {} | |
| return colors[i - 1]; | |
| } | |
| function roundIncidence(incidence) { | |
| incidence = Math.round(incidence * 10) / 10; | |
| return incidence; | |
| } | |
| function formatIncidence(incidence) { | |
| if (incidence <= 100) { | |
| return Intl.NumberFormat('de-DE', { | |
| minimumFractionDigits: 1 | |
| }).format(incidence); | |
| } else { | |
| return Intl.NumberFormat('de-DE', { | |
| maximumFractionDigits: 0 | |
| }).format(incidence); | |
| } | |
| } | |
| function isToday(date) { | |
| const today = new Date() | |
| return date.getDate() === today.getDate() && | |
| date.getMonth() === today.getMonth() && | |
| date.getFullYear() === today.getFullYear(); | |
| }; |
Schön, wenn sich das hier von alleine löst. Ich muss das alles (Installation und Parametrierung) unbedingt dokumentieren. Ein Issue gibt es schon dafür marcusraitner/COVID-19-Dashboard#58 Dürft ihr gern ergänzen … Ganz gut beschrieben war es auch hier: https://www.iphone-ticker.de/covid-19-dashboard-iphone-widget-zeigt-lokale-inzidenzen-174666/
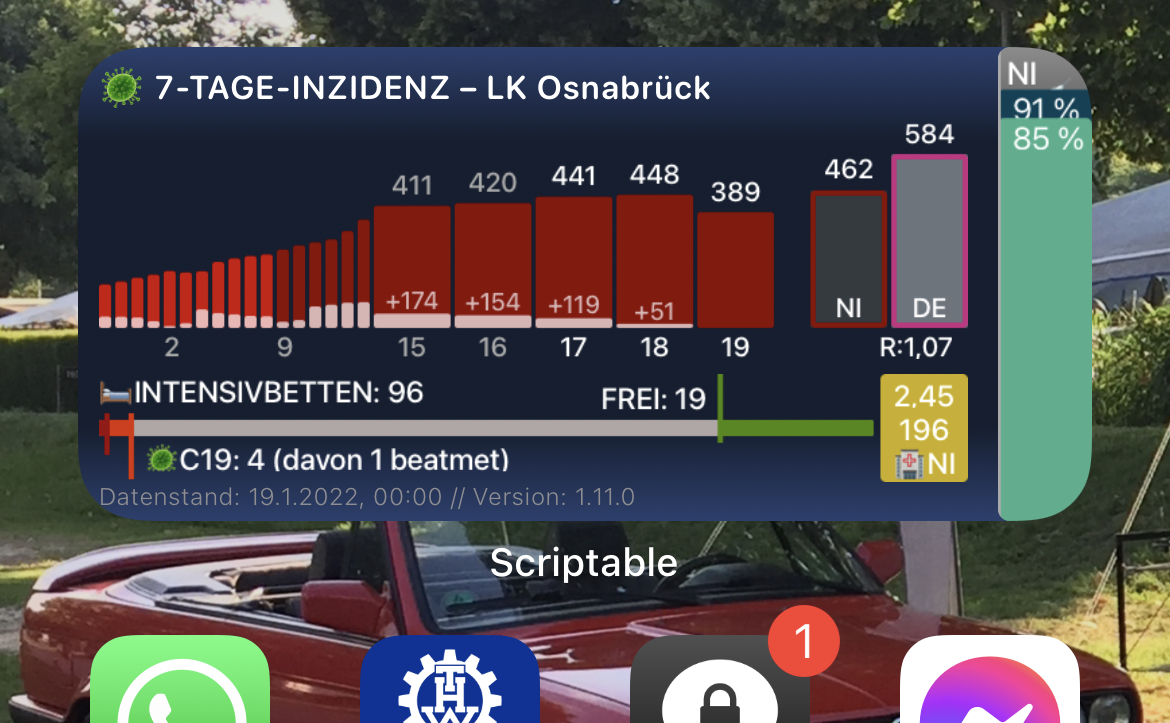
Bei mir sind alle Balken grau. Müssten die nicht grün, orange, rot sein? Oder muss ich das irgendwie einstellen?

Schätze dich glücklich! Grau heißt < 35 und das ist doch gut. Im Ernst: Die Farbe des Balken hängt von der Inzidenz ab; du findest das im Code in der Variable incidenceColors und in deinem Fall darin im Theme original.
Wow. Ich sollte wohl Mal updaten. 😇
Das grau in grün ändern ist doch gar nicht so schwer. Je niedriger es wird, desto dunkelgrüner sind bei mir die Balken. Wobei ich eigentlich fast schon davon ausgehe, dass wir bald wieder im gelben bzw. Orangenen Bereich sein werden.
Jedenfalls, Klasse Arbeit! Danke für das tolle Widget! 👍👍👍👍👍
Schätze dich glücklich! Grau heißt < 35 und das ist doch gut. Im Ernst: Die Farbe des Balken hängt von der Inzidenz ab; du findest das im Code in der Variable
incidenceColorsund in deinem Fall darin im Themeoriginal.
Wie kann ich es denn ändern, das die Balken unter 35 grün sind. Fände das einfach schöner.
Kann man die Zahlen am Graphen nicht etwas weiter weg platzieren?
Bei mir kommen sich die Veränderung und der jeweilige Stand in die Quere…

Schätze dich glücklich! Grau heißt < 35 und das ist doch gut. Im Ernst: Die Farbe des Balken hängt von der Inzidenz ab; du findest das im Code in der Variable
incidenceColorsund in deinem Fall darin im Themeoriginal.Wie kann ich es denn ändern, das die Balken unter 35 grün sind. Fände das einfach schöner.
Ersetze einfach den Part von „const incidenceColors…“ bis zum ]; mit dem Codeschnipsel hier, dann hast du es wie ich in meinem Screenshot von vorhin. Je dunkler desto niedriger.
const incidenceColors = [{
lower: 0,
color: new Color('#006400',1)
},
{
lower: 10,
color: new Color('#66CD00', 1)
},
{
lower: 25,
color: new Color('FFFF00', 1)
},
{
lower: 35,
color: new Color('#FFBA08', 1)
},
{
lower: 50,
color: new Color('#F48C06', 1)
},
{
lower: 100,
color: new Color('#E85D04', 1)
},
{
lower: 165,
color: new Color('#DC2F02', 1)
},
{
lower: 300,
color: new Color('#9D0208', 1)
}
];
Kann man die Zahlen am Graphen nicht etwas weiter weg platzieren?
Hol dir mal den letzten Codestand hier: https://github.com/marcusraitner/COVID-19-Dashboard Das habe ich eigentlich dort schon behoben, bloß noch nicht released.
Schätze dich glücklich! Grau heißt < 35 und das ist doch gut. Im Ernst: Die Farbe des Balken hängt von der Inzidenz ab; du findest das im Code in der Variable
incidenceColorsund in deinem Fall darin im Themeoriginal.Wie kann ich es denn ändern, das die Balken unter 35 grün sind. Fände das einfach schöner.
Ersetze einfach den Part von „const incidenceColors…“ bis zum ]; mit dem Codeschnipsel hier, dann hast du es wie ich in meinem Screenshot von vorhin. Je dunkler desto niedriger.
const incidenceColors = [{
lower: 0,
color: new Color('#6400',1)
},
{
lower: 10,
color: new Color('#66CD00', 1)
},
{
lower: 25,
color: new Color('FFFF00', 1)
},
{
lower: 35,
color: new Color('#FFBA08', 1)
},
{
lower: 50,
color: new Color('#F48C06', 1)
},
{
lower: 100,
color: new Color('#E85D04', 1)
},
{
lower: 165,
color: new Color('#DC2F02', 1)
},
{
lower: 300,
color: new Color('#9D0208', 1)
}
];
Wenn du dir den aktuellen Codestand unter https://github.com/marcusraitner/COVID-19-Dashboard ansiehst, dann könntest du daraus auch ein eigenes Theme machen, das du über Parameter auswählen kannst.
Hallo Marcus, wollte mich mal für die gute Arbeit bedanken. Ich habe seit heute früh Probleme das Script zu öffnen. Es stürzt gleich ab wenn ich es aufmache. Hat jemand anders auch dieses Problem? Gestern hat noch alles funktioniert. Grüße Donigi
Danke @Donigi-77! Das Problem scheint an der API dahinter zu liegen, s. marcusraitner/COVID-19-Dashboard#80 Du kannst das Problem vermutlich umgehen indem du als Parameter de=n setzt. Probier das bitte mal.
Danke @marcusraitner das hat super funktioniert.
Hey @marcusraitner !
Gibt es eine Chance auf die Hospitalisierungsinzidenz in Deinem Format?
Hallo,
ich würde mich über eine Integration von https://semohr.github.io/risikogebiete_deutschland/
freuen. Und dabei die Altersgruppe wählen. Es geht um die Kinder, die sich noch nicht impfen lassen können.
Viele Grüße!
Hey @marcusraitner !
Gibt es eine Chance auf die Hospitalisierungsinzidenz in Deinem Format?
Gibt es. Im Moment hängt es wie immer am RKI und dem Grundverständnis von Digitalisierung in D, wo ein CSV auf einem Webserver das höchste der Gefühle ist. Es wird aber schon an der Datenquelle gearbeitet und dann schau ich mal: marlon360/rki-covid-api#275
Hallo,
ich würde mich über eine Integration von https://semohr.github.io/risikogebiete_deutschland/ freuen. Und dabei die Altersgruppe wählen. Es geht um die Kinder, die sich noch nicht impfen lassen können.
Viele Grüße!
Interessante Idee. Magst du mir bitte hier einen Issue aufmachen, dann können wir die Idee fokussiert weiter diskutieren: https://github.com/marcusraitner/COVID-19-Dashboard/issues
Applause für V1.10
Applause für V1.10
Danke! Und jetzt auch als V1.10.1 mit Option um Abschalten der Hospitalisierungsinzidenz.
Ich glaube die Anzeige über die Impfungen stimmt im Moment nicht. Liegt das an den Daten die von der API kommen?
Ich würde mich freue , wenn diese Daten stimmen würden. Aber in Niedersachsen haben wir nicht so viel beim Boostern.
@jpht80 Ja, ist die API, bzw. das RKI mit ihrem Excel und dem Praktikanten der daran rumpfuscht ;-) siehe: marcusraitner/COVID-19-Dashboard#101
Seit heute Morgen plötzlich kaputt:
Error on line 988:63: TypeError: undefined is not an object (evaluating
'hospitalizationData.data[bundesLand]')
Was kann ich machen?
@permaMonk Du kannst hosp=n setzen als Parameter des Widgets. Hier scheint es (mal wieder) ein Problem mit der API zu geben, weil (mal wieder) irgendjemand beim RKI am Excel rumgespielt hat. Siehe auch marlon360/rki-covid-api#388
hosp=n hat funktioniert. Danke. :)
Was ändert diese Funktion.
Die regelt, ob die Hospitalisierungsdaten angezeigt werden sollen (und der Aufruf für diese Daten läuft im Moment auf einen Fehler).
Tja die sind aber nicht uninteressant. Wie kommst du oder ich zu der Info, dass diese wieder abrufbar sind?
Einfach von Zeit zu Zeit wieder probieren. Oder schauen, wann dieses Issue in der API geschlossen ist: marlon360/rki-covid-api#388
seit ein paar Tagen…vermutlich seit 1. März kommt nur noch:
2023-03-05 23:18:35: Error on line 987:63: TypeError: undefined is not an object (evaluating 'hospitalizationData.data[bundesLand]')
Ja, wieder mal eine Umstellung beim RKI. Es wird daran gearbeitet marcusraitner/COVID-19-Dashboard#119
COOL! Das war einfach.
Und ich hatte angefangen im Code nach vac und so zu suchen ... Jetzt läuft es wieder. Danke Dir!