-
download the source data
wget http://fred.dev.openstreetmap.org/density/tiles.13 wget http://fred.dev.openstreetmap.org/density/tiles.16 -
convert to simple, gnuplot-readable text format
sed 's/\([0-9]*\) z=\([0-9]*\) x=\([0-9]*\) y=\([0-9]*\)/\3 \4 \1/' < tiles.13 > tiles.13.txt sed 's/\([0-9]*\) z=\([0-9]*\) x=\([0-9]*\) y=\([0-9]*\)/\3 \4 \1/' < tiles.16 > tiles.16.txt -
start gnuplot
gnuplot -
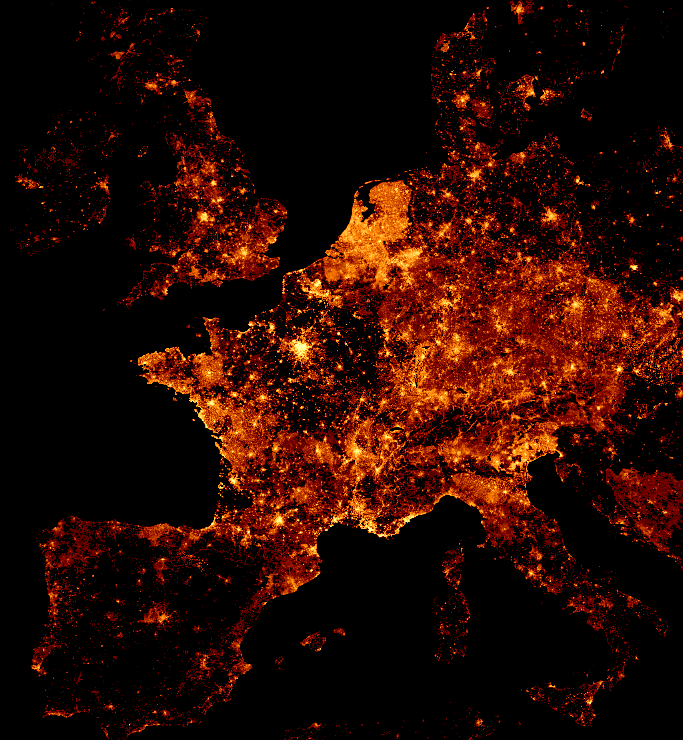
use gnuplot to create the map
reset unset xtics unset ytics unset border unset key unset legend unset title set lmargin at screen 0 set tmargin at screen 0 set rmargin at screen 1 set bmargin at screen 1 set palette rgbformulae 34,35,36 width = 1024 set xrange [0:width-1] set yrange [0:width] set object rectangle from screen 0,0 to screen 1,1 fillcolor rgb"#000000" behind set terminal png size width,width set output "density.13.png" plot 'tiles.13.txt' using ($1/8):(width-1-$2/8):(log($3)) with dots palette -
repeat with zoom-16 tiles (don't forget to adapt the numbers above)
-
-
Save matiskay/4513ae7e3b4a38454864 to your computer and use it in GitHub Desktop.
Sign up for free
to join this conversation on GitHub.
Already have an account?
Sign in to comment