Suppose we want to interpolate a number of points along each line in a layer:
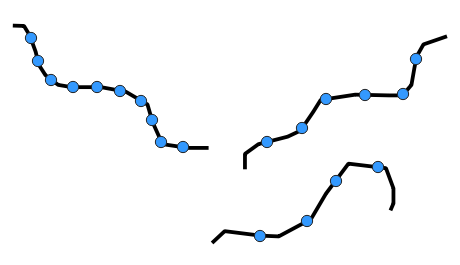
We have a column called stations that specifies how many points to
interpolate on each line:

| #!/usr/bin/env python | |
| '''Crop an image to just the portions containing text. | |
| Usage: | |
| ./crop_morphology.py path/to/image.jpg | |
| This will place the cropped image in path/to/image.crop.png. | |
| For details on the methodology, see |
| import ee | |
| ee.Initialize() | |
| geom = ee.Geometry.Polygon( | |
| [[[-112.115478515625, 39.60899451189312], | |
| [-112.1044921875, 38.81737493267723], | |
| [-111.126708984375, 38.7659965678143], | |
| [-111.038818359375, 39.59206441884747]]]) | |
| # Define years of interest |
Make sure ffmpeg is up-to-date:
brew update
brew upgrade ffmpeg
Convert a MOV into frames. Tweak the 2/1 if you want more or fewer frames.
The Leaflet JS mapping library has lots of plugins available. The Leaflet package for R provides direct support for some, but far from all, of these plugins, by providing R functions for invoking the plugins.
If you as an R user find yourself wanting to use a Leaflet plugin that isn't directly supported in the R package, you can use the technique shown here to load the plugin yourself and invoke it using JS code.
See this link for an introduction on time stacking and time slicing.
time_slice.R requires the number of pixels wide or tall the image is to be a multiple of the number of images in your timelapse.
time_slice_v2.R attempts to get around this. Some images will contribute more pixels per slice than others. This is done by making the first x% of the images cover the first x% of the pixels (with appropriate rounding). It does not deal with number of images being greater than the height or width of the images in pixels. Version 2 will probably work better for you.
For example, if the images are 150 pixels wide and your timelapse has 100 images, time_slice.R will make the first image have a slice which is 51 pixels wide. The remaining 99 images will get slices which are 1 pixel wide. time_slice_v2.R will alternate between 1 pixel per i
| # Combine multiple images into one. | |
| # | |
| # To install the Pillow module on Mac OS X: | |
| # | |
| # $ xcode-select --install | |
| # $ brew install libtiff libjpeg webp little-cms2 | |
| # $ pip install Pillow | |
| # | |
| from __future__ import print_function |
| # Script for question posted on Stack Overflow | |
| # Load relevant libraries | |
| library(ggplot2) | |
| library(raster) | |
| library(gridExtra) | |
| vplayout <- function(x, y) { | |
| viewport(layout.pos.row = x, layout.pos.col = y) | |
| } |