-
-
Save mstfldmr/45d6e47bb661800b982c39d30215bc88 to your computer and use it in GitHub Desktop.
| from matplotlib import pyplot as plt | |
| import cv2 | |
| img = cv2.imread('/Users/mustafa/test.jpg') | |
| gray = cv2.cvtColor(img, cv2.COLOR_BGR2GRAY) | |
| plt.imshow(gray) | |
| plt.title('my picture') | |
| plt.show() |
Or, you could do img2 = img[:,:,::-1] where img is the color image (read by imread ).
Sample code,
from matplotlib import pyplot as plt
import numpy as np
import cv2

img = cv2.imread('img.jpg')
img2 = img[:,:,::-1]
plt.imshow(img)
@sudoankit How does that work? ::-1 == ?
@lordlycastle it's the slice notation: you can use a negative step in python to reverse objects, and it's quite common.
Official doc on slicing: https://docs.python.org/3/tutorial/introduction.html
Thread on slicing on SO: https://stackoverflow.com/questions/509211/understanding-pythons-slice-notation
Edit: in particular, img[:,:,::-1] is numpy slicing, which means that we select all the elements on the first axis, all the elements on the seconds, and then the reverse of the elements on the third axis.
Just for completion, the last line should be plt.imshow(img2)
Or, you could do
img2 = img[:,:,::-1]whereimgis the color image (read byimread).Sample code,
from matplotlib import pyplot as plt
import numpy as np
import cv2

img = cv2.imread('img.jpg')
img2 = img[:,:,::-1]
plt.imshow(img)
This is good! Thank you
The best sample code I've found to reproduce a colour picture in Jupyter notebook is:
from matplotlib import pyplot as plt
import cv2

path = r'/home/<userID>/Documents/opencv-4.3.0/samples/data/messi5.jpg'  # <userID> is the logged in userID.

img = cv2.imread(path, 1)  #Best practise is to specify the flag you want set, confirming you want a colour picture.

img2 = cv2.cvtColor(img, cv2.COLOR_BGR2RGB) #Converts from one colour space to the other

plt.imshow(img2)
plt.xticks([]), plt.yticks([])  # Hides the graph ticks and x / y axis
plt.show()
I find the example above, the one that uses
img2 = img[:,:,::-1]
The colour reproduction is not accurate. It looks quite saturated in some areas, unsaturated in others. Also, if you play around with the flags, from the default "1" in the imread() methods, the code snipet above is quite flexible. I've tried it with flags = 0, flag = -1, flag = 1 and it reproduces according to the set flag.
The other one not so much, because it's doing a matrix transformation (matrix inversion?) to convert it from RGB to BGR (OpenCV uses one colour space, matplotlib uses the other).
Depending on what your ultimate goal is for the image, these are things to take into consideration in Jupyter Notebooks.
For Google Colab the best work around is this:
import cv2
from google.colab.patches import cv2_imshow

path = r'/content/messi5.jpg' #Google drive path

img = cv2.imread(path, 1) #Specify the flag, as a best practice

cv2_imshow(img)
We can also use display() of IPython.display module and Image.fromarray() of PIL module
from PIL import Image
import cv2
from IPython.display import display

img = cv2.imread('image.png') # with the OpenCV function imread(), the order of colors is BGR (blue, green, red).

# In Pillow, the order of colors is assumed to be RGB (red, green, blue).
# As we are using Image.fromarray() of PIL module, we need to convert BGR to RGB.

img = cv2.cvtColor(img, cv2.COLOR_BGR2RGB) # Converting BGR to RGB

display(Image.fromarray(img))
@Rage-ops
Great! It's work for me.
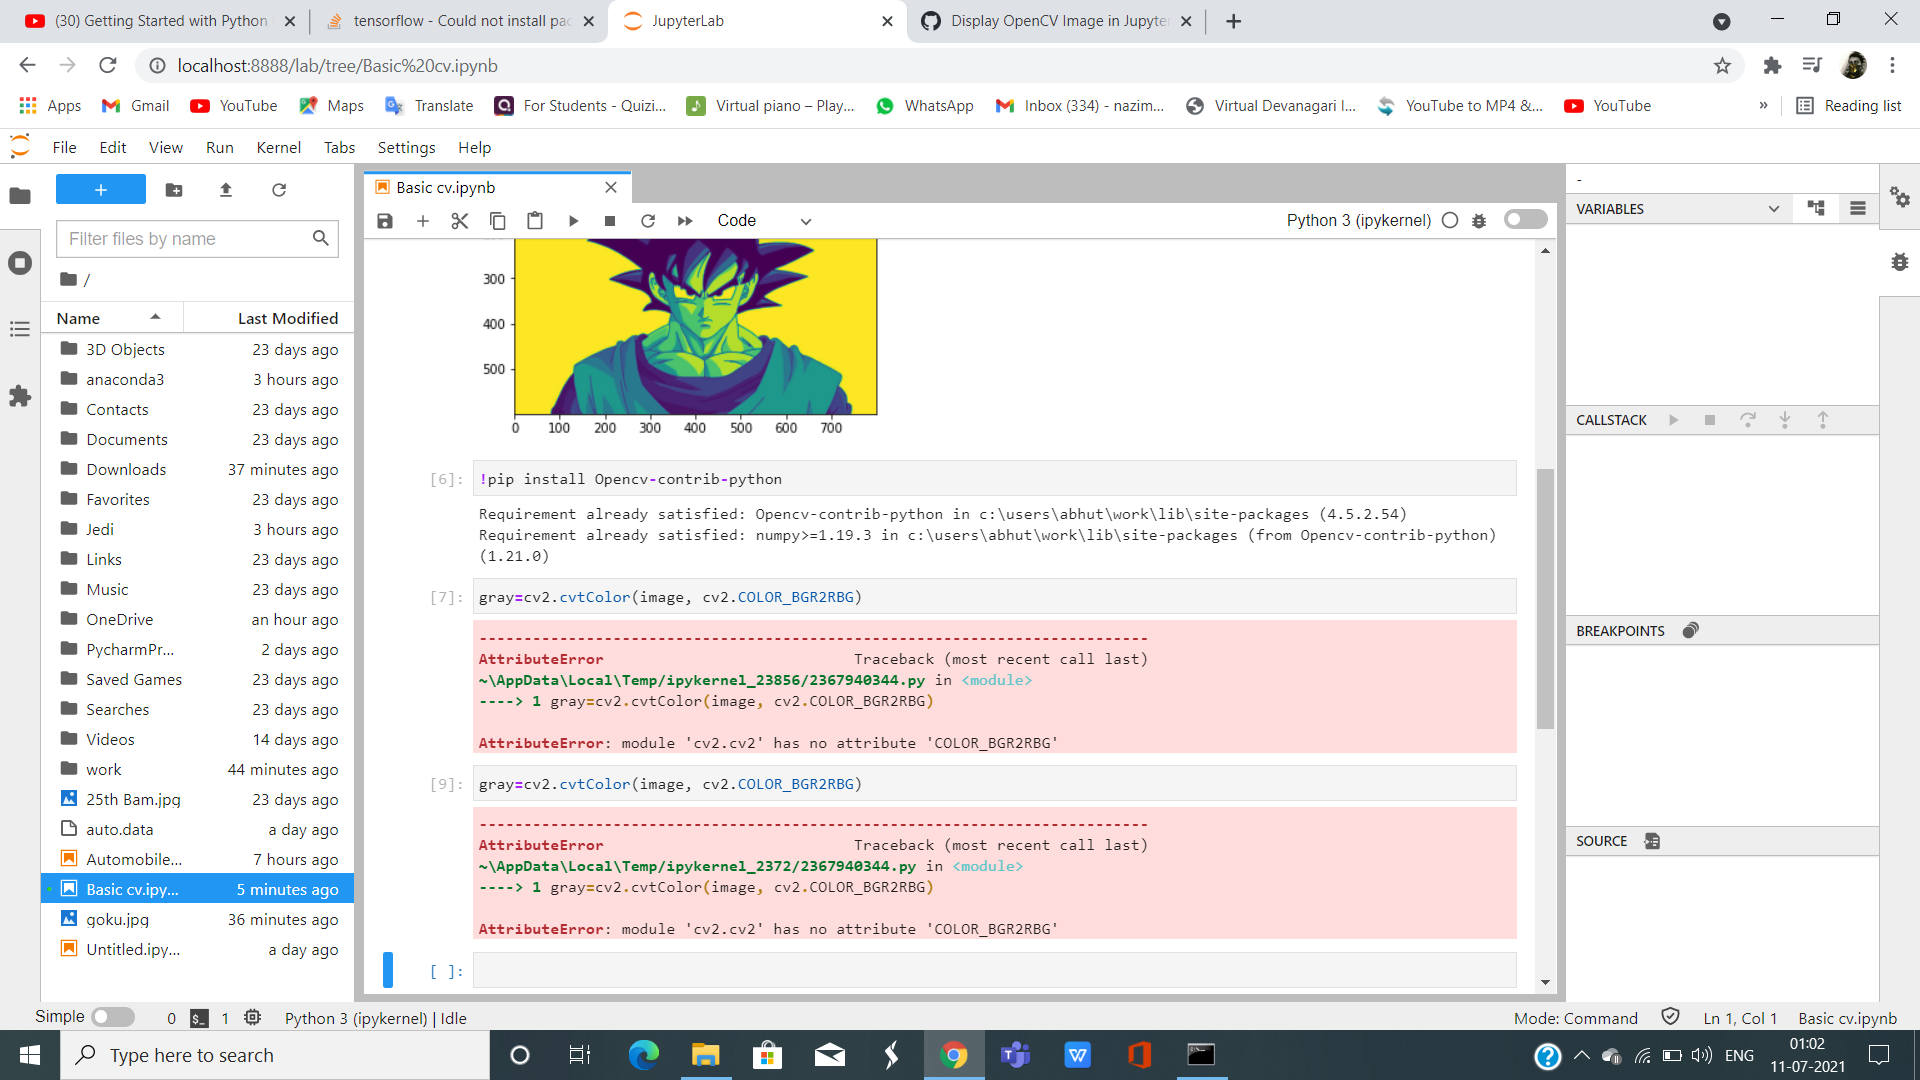
What should we do if we get: "AttributeError: module 'cv2.cv2' has no attribute 'COLOR_BGR2RBG'"
What should we do if we get: "AttributeError: module 'cv2.cv2' has no attribute 'COLOR_BGR2RBG'"
Try COLOR_BGR2RGB (RGB, not RBG).
We can also use
display()of IPython.display module andImage.fromarray()of PIL modulefrom PIL import Image import cv2 from IPython.display import display img = cv2.imread('image.png') # with the OpenCV function imread(), the order of colors is BGR (blue, green, red). # In Pillow, the order of colors is assumed to be RGB (red, green, blue). # As we are using Image.fromarray() of PIL module, we need to convert BGR to RGB. img = cv2.cvtColor(img, cv2.COLOR_BGR2RGB) # Converting BGR to RGB display(Image.fromarray(img))
Worked really nice! Thank you so much!
Here is a simple function based on the code above to display the image with an optional title.
def show_rgb_image(image, title=None, conversion=cv2.COLOR_BGR2RGB):

    # Converts from one colour space to the other. this is needed as RGB
    # is not the default colour space for OpenCV
    image = cv2.cvtColor(image, conversion)

    # Show the image
    plt.imshow(image)

    # remove the axis / ticks for a clean looking image
    plt.xticks([])
    plt.yticks([])

    # if a title is provided, show it
    if title is not None:
        plt.title(title)

    plt.show()
Usage is simple:
image = cv2.imread(r'c:\Users\johan\Pictures\road.jpg')
show_rgb_image(image, 'Original Image')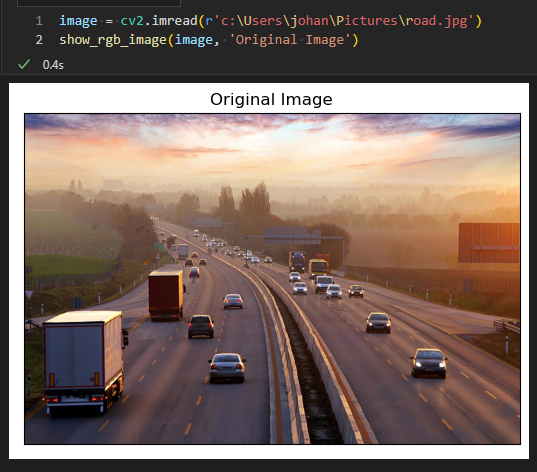
One more example for displaying a color image. Matplot lib expects img in RGB format but OpenCV provides it in BGR.
RGB_im = cv2.cvtColor(im, cv2.COLOR_BGR2RGB)


One more example for displaying a color image.
Matplot lib expects img in RGB format but OpenCV provides it in BGR.
RGB_im = cv2.cvtColor(im, cv2.COLOR_BGR2RGB)