-
-
Save nicoddemus/da4a727aef09de0dd0cfd2d1a6043104 to your computer and use it in GitHub Desktop.
| # from: https://doc.qt.io/qt-5/qtcharts-nesteddonuts-example.html | |
| import functools | |
| import random | |
| from PyQt5.QtChart import * | |
| from PyQt5.QtGui import * | |
| from PyQt5.QtCore import * | |
| from PyQt5.QtWidgets import * | |
| class Widget(QWidget): | |
| def __init__(self): | |
| super().__init__() | |
| self.setMinimumSize(800, 600) | |
| self.m_donuts = [] | |
| self.chartView = QChartView() | |
| self.chartView.setRenderHint(QPainter.Antialiasing) | |
| self.chart = self.chartView.chart() | |
| self.chart.legend().setVisible(False) | |
| self.chart.setTitle("Nested donuts demo") | |
| self.chart.setAnimationOptions(QChart.AllAnimations) | |
| minSize = 0.1 | |
| maxSize = 0.9 | |
| donutCount = 5 | |
| for i in range(donutCount): | |
| donut = QPieSeries() | |
| sliceCount = random.randrange(3, 6) | |
| for j in range(sliceCount): | |
| value = random.randrange(100, 200) | |
| slice_ = QPieSlice(str(value), value) | |
| slice_.setLabelVisible(True) | |
| slice_.setLabelColor(Qt.white) | |
| slice_.setLabelPosition(QPieSlice.LabelInsideTangential) | |
| slice_.hovered[bool].connect(functools.partial(self.explodeSlice, slice_=slice_)) | |
| donut.append(slice_) | |
| donut.setHoleSize(minSize + i * (maxSize - minSize) / donutCount) | |
| donut.setPieSize(minSize + (i + 1) * (maxSize - minSize) / donutCount) | |
| self.m_donuts.append(donut) | |
| self.chartView.chart().addSeries(donut) | |
| # create main layout | |
| self.mainLayout = QGridLayout(self) | |
| self.mainLayout.addWidget(self.chartView, 1, 1) | |
| self.chartView.show() | |
| self.setLayout(self.mainLayout) | |
| self.updateTimer = QTimer(self) | |
| self.updateTimer.timeout.connect(self.updateRotation) | |
| self.updateTimer.start(1250) | |
| def updateRotation(self): | |
| for donut in self.m_donuts: | |
| phaseShift = random.randrange(-50, 100) | |
| donut.setPieStartAngle(donut.pieStartAngle() + phaseShift) | |
| donut.setPieEndAngle(donut.pieEndAngle() + phaseShift) | |
| def explodeSlice(self, exploded, slice_): | |
| if exploded: | |
| self.updateTimer.stop() | |
| sliceStartAngle = slice_.startAngle() | |
| sliceEndAngle = slice_.startAngle() + slice_.angleSpan() | |
| donut = slice_.series() | |
| seriesIndex = self.m_donuts.index(donut) | |
| for i in range(seriesIndex + 1, len(self.m_donuts)): | |
| self.m_donuts[i].setPieStartAngle(sliceEndAngle) | |
| self.m_donuts[i].setPieEndAngle(360 + sliceStartAngle) | |
| else: | |
| for donut in self.m_donuts: | |
| donut.setPieStartAngle(0) | |
| donut.setPieEndAngle(360) | |
| self.updateTimer.start() | |
| slice_.setExploded(exploded) | |
| a = QApplication([]) | |
| w = Widget() | |
| w.show() | |
| a.exec_() |
| # from: https://doc.qt.io/qt-5/qtcharts-percentbarchart-example.html | |
| from PyQt5.QtChart import * | |
| from PyQt5.QtGui import * | |
| from PyQt5.QtCore import * | |
| from PyQt5.QtWidgets import * | |
| a = QApplication([]) | |
| set0 = QBarSet("Jane") | |
| set1 = QBarSet("John") | |
| set2 = QBarSet("Axel") | |
| set3 = QBarSet("Mary") | |
| set4 = QBarSet("Samantha") | |
| set0 << 1 << 2 << 3 << 4 << 5 << 6 | |
| set1 << 5 << 0 << 0 << 4 << 0 << 7 | |
| set2 << 3 << 5 << 8 << 13 << 8 << 5 | |
| set3 << 5 << 6 << 7 << 3 << 4 << 5 | |
| set4 << 9 << 7 << 5 << 3 << 1 << 2 | |
| series = QPercentBarSeries() | |
| series.append(set0) | |
| series.append(set1) | |
| series.append(set2) | |
| series.append(set3) | |
| series.append(set4) | |
| chart = QChart() | |
| chart.addSeries(series) | |
| chart.setTitle("Simple percentbarchart example") | |
| chart.setAnimationOptions(QChart.SeriesAnimations) | |
| categories = ["Jan", "Feb", "Mar", "Apr", "May", "Jun"] | |
| axis = QBarCategoryAxis() | |
| axis.append(categories) | |
| chart.createDefaultAxes() | |
| chart.setAxisX(axis, series) | |
| chart.legend().setVisible(True) | |
| chart.legend().setAlignment(Qt.AlignBottom) | |
| chartView = QChartView(chart) | |
| chartView.setRenderHint(QPainter.Antialiasing) | |
| window = QMainWindow() | |
| window.setCentralWidget(chartView) | |
| window.resize(420, 300) | |
| window.show() | |
| a.exec_() |
| # from https://doc.qt.io/qt-5/qtcharts-temperaturerecords-example.html | |
| from PyQt5.QtChart import * | |
| from PyQt5.QtGui import * | |
| from PyQt5.QtCore import * | |
| from PyQt5.QtWidgets import * | |
| a = QApplication([]) | |
| low = QBarSet("Min") | |
| high = QBarSet("Max") | |
| low << -52 << -50 << -45.3 << -37.0 << -25.6 << -8.0 << -6.0 << -11.8 << -19.7 << -32.8 << -43.0 << -48.0 | |
| high << 11.9 << 12.8 << 18.5 << 26.5 << 32.0 << 34.8 << 38.2 << 34.8 << 29.8 << 20.4 << 15.1 << 11.8 | |
| series = QStackedBarSeries() | |
| series.append(low) | |
| series.append(high) | |
| chart = QChart() | |
| chart.addSeries(series) | |
| chart.setTitle("Temperature records in celcius") | |
| chart.setAnimationOptions(QChart.SeriesAnimations) | |
| categories = ["Jan", "Feb", "Mar", "Apr", "May", "Jun", "Jul", "Aug", "Sep", "Oct", "Nov", "Dec"] | |
| axis = QBarCategoryAxis() | |
| axis.append(categories) | |
| axis.setTitleText("Month") | |
| chart.createDefaultAxes() | |
| chart.setAxisX(axis, series) | |
| chart.axisY(series).setRange(-52, 52) | |
| chart.axisY(series).setTitleText("Temperature [°C]") | |
| chart.legend().setVisible(True) | |
| chart.legend().setAlignment(Qt.AlignBottom) | |
| chartView = QChartView(chart) | |
| chartView.setRenderHint(QPainter.Antialiasing) | |
| window = QMainWindow() | |
| window.setCentralWidget(chartView) | |
| window.resize(600, 300) | |
| window.show() | |
| a.exec_() |
You need to install PyQtChart. 👍
I am trying to create and update bar graph dynamically. I am able to create the graph, but getting the below error when trying to update it dynamically.
Graph is created using QChart. Getting the below error for all the data that is coming from the port and display the graph at the end without any dynamic update. Error says Can not add series. Series already on the chart.
show the code, what version windows, pyqt are You using, Can you test with pyside2.?
hi. great examples. Is it possible to have a subfunction in order to refresh data? For example: I have a chart with yearly data. I want to update the chart data when I change the item in combobox which include years(2019,2020,2021).
I use QtChart as your examples.
def chart_one_create(self):
result_oneYear = login_query.connection.login_chart_oneYear(self, widgets.user_tb.text(), widgets.pass_tb.text(), widgets.chart_years_ccb.currentText()) ## just a sql query that brings me the data, it works.
self.set_tkf = QBarSet("TAEKWON-DO")
self.set_fenc = QBarSet("ΞΙΦΑΣΚΙΑ")
self.set_oplo = QBarSet("ΟΠΛΟΜΑΧΙΑ")
self.set_spends = QBarSet("ΕΞΟΔΑ")
for i in range(len(result_oneYear[0])): #modify my sieries .
if result_oneYear[1][i][0] is None:
tkd = 0
else:
tkd = result_oneYear[1][i][0]
self.set_tkf.append(tkd)
if result_oneYear[1][i][1] is None:
fenc = 0
else:
fenc = result_oneYear[1][i][1]
self.set_fenc.append(fenc)
if result_oneYear[1][i][2] is None:
oplo = 0
else:
oplo = result_oneYear[1][i][2]
self.set_oplo.append(oplo)
if result_oneYear[1][i][3] is None:
spen = 0
else:
spen = result_oneYear[1][i][3]
self.set_spends.append(spen)
self.series = QBarSeries()
self.series.append(self.set_tkf)
self.series.append(self.set_fenc)
self.series.append(self.set_oplo)
self.series.append(self.set_spends)
self.categories = result_oneYear[0]
self.chart = QChart()
self.chart.addSeries(self.series)
self.chart.setTitle("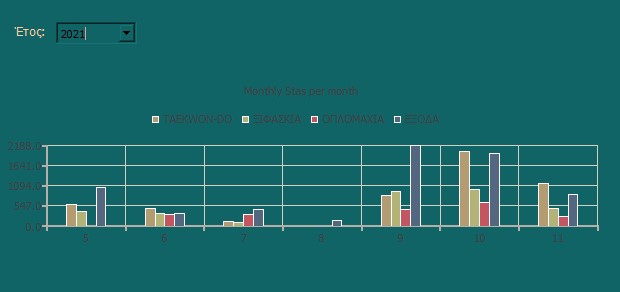")
self.chart.setAnimationOptions(QChart.AllAnimations)
self.chart.setTheme(QChart.ChartThemeBrownSand)
self.chart.setBackgroundBrush(QBrush(QColor("transparent")))
axis = QBarCategoryAxis()
axis.append(self.categories)
self.chart.createDefaultAxes()
self.chart.setAxisX(axis, self.series)
self.chartview = QChartView(self.chart)
vbox = QGridLayout(widgets.chart_one_fm)
vbox.setContentsMargins(0, 0, 0, 0)
vbox.addWidget(self.chartview)
self.update_chart_one()
def update_chart_one(self):
self.series.clear()
???????????????????????
As you can see i have a functional QtChart in my ui and works fine at start up. My problem is when i change the combobox item. I cant figure how to update the data in this chart. I trigger with success my def chart_one_create(self).
thnx

.
Hi.., Im using Pyqt5, but my pc tell.. " No module name PyQt5.QtChart " how do you install this module?