Last active
November 14, 2021 16:48
-
-
Save nicoddemus/da4a727aef09de0dd0cfd2d1a6043104 to your computer and use it in GitHub Desktop.
Some QtCharts examples converted to PyQt: https://doc.qt.io/qt-5/qtcharts-examples.html
This file contains bidirectional Unicode text that may be interpreted or compiled differently than what appears below. To review, open the file in an editor that reveals hidden Unicode characters.
Learn more about bidirectional Unicode characters
| # from: https://doc.qt.io/qt-5/qtcharts-nesteddonuts-example.html | |
| import functools | |
| import random | |
| from PyQt5.QtChart import * | |
| from PyQt5.QtGui import * | |
| from PyQt5.QtCore import * | |
| from PyQt5.QtWidgets import * | |
| class Widget(QWidget): | |
| def __init__(self): | |
| super().__init__() | |
| self.setMinimumSize(800, 600) | |
| self.m_donuts = [] | |
| self.chartView = QChartView() | |
| self.chartView.setRenderHint(QPainter.Antialiasing) | |
| self.chart = self.chartView.chart() | |
| self.chart.legend().setVisible(False) | |
| self.chart.setTitle("Nested donuts demo") | |
| self.chart.setAnimationOptions(QChart.AllAnimations) | |
| minSize = 0.1 | |
| maxSize = 0.9 | |
| donutCount = 5 | |
| for i in range(donutCount): | |
| donut = QPieSeries() | |
| sliceCount = random.randrange(3, 6) | |
| for j in range(sliceCount): | |
| value = random.randrange(100, 200) | |
| slice_ = QPieSlice(str(value), value) | |
| slice_.setLabelVisible(True) | |
| slice_.setLabelColor(Qt.white) | |
| slice_.setLabelPosition(QPieSlice.LabelInsideTangential) | |
| slice_.hovered[bool].connect(functools.partial(self.explodeSlice, slice_=slice_)) | |
| donut.append(slice_) | |
| donut.setHoleSize(minSize + i * (maxSize - minSize) / donutCount) | |
| donut.setPieSize(minSize + (i + 1) * (maxSize - minSize) / donutCount) | |
| self.m_donuts.append(donut) | |
| self.chartView.chart().addSeries(donut) | |
| # create main layout | |
| self.mainLayout = QGridLayout(self) | |
| self.mainLayout.addWidget(self.chartView, 1, 1) | |
| self.chartView.show() | |
| self.setLayout(self.mainLayout) | |
| self.updateTimer = QTimer(self) | |
| self.updateTimer.timeout.connect(self.updateRotation) | |
| self.updateTimer.start(1250) | |
| def updateRotation(self): | |
| for donut in self.m_donuts: | |
| phaseShift = random.randrange(-50, 100) | |
| donut.setPieStartAngle(donut.pieStartAngle() + phaseShift) | |
| donut.setPieEndAngle(donut.pieEndAngle() + phaseShift) | |
| def explodeSlice(self, exploded, slice_): | |
| if exploded: | |
| self.updateTimer.stop() | |
| sliceStartAngle = slice_.startAngle() | |
| sliceEndAngle = slice_.startAngle() + slice_.angleSpan() | |
| donut = slice_.series() | |
| seriesIndex = self.m_donuts.index(donut) | |
| for i in range(seriesIndex + 1, len(self.m_donuts)): | |
| self.m_donuts[i].setPieStartAngle(sliceEndAngle) | |
| self.m_donuts[i].setPieEndAngle(360 + sliceStartAngle) | |
| else: | |
| for donut in self.m_donuts: | |
| donut.setPieStartAngle(0) | |
| donut.setPieEndAngle(360) | |
| self.updateTimer.start() | |
| slice_.setExploded(exploded) | |
| a = QApplication([]) | |
| w = Widget() | |
| w.show() | |
| a.exec_() |
This file contains bidirectional Unicode text that may be interpreted or compiled differently than what appears below. To review, open the file in an editor that reveals hidden Unicode characters.
Learn more about bidirectional Unicode characters
| # from: https://doc.qt.io/qt-5/qtcharts-percentbarchart-example.html | |
| from PyQt5.QtChart import * | |
| from PyQt5.QtGui import * | |
| from PyQt5.QtCore import * | |
| from PyQt5.QtWidgets import * | |
| a = QApplication([]) | |
| set0 = QBarSet("Jane") | |
| set1 = QBarSet("John") | |
| set2 = QBarSet("Axel") | |
| set3 = QBarSet("Mary") | |
| set4 = QBarSet("Samantha") | |
| set0 << 1 << 2 << 3 << 4 << 5 << 6 | |
| set1 << 5 << 0 << 0 << 4 << 0 << 7 | |
| set2 << 3 << 5 << 8 << 13 << 8 << 5 | |
| set3 << 5 << 6 << 7 << 3 << 4 << 5 | |
| set4 << 9 << 7 << 5 << 3 << 1 << 2 | |
| series = QPercentBarSeries() | |
| series.append(set0) | |
| series.append(set1) | |
| series.append(set2) | |
| series.append(set3) | |
| series.append(set4) | |
| chart = QChart() | |
| chart.addSeries(series) | |
| chart.setTitle("Simple percentbarchart example") | |
| chart.setAnimationOptions(QChart.SeriesAnimations) | |
| categories = ["Jan", "Feb", "Mar", "Apr", "May", "Jun"] | |
| axis = QBarCategoryAxis() | |
| axis.append(categories) | |
| chart.createDefaultAxes() | |
| chart.setAxisX(axis, series) | |
| chart.legend().setVisible(True) | |
| chart.legend().setAlignment(Qt.AlignBottom) | |
| chartView = QChartView(chart) | |
| chartView.setRenderHint(QPainter.Antialiasing) | |
| window = QMainWindow() | |
| window.setCentralWidget(chartView) | |
| window.resize(420, 300) | |
| window.show() | |
| a.exec_() |
This file contains bidirectional Unicode text that may be interpreted or compiled differently than what appears below. To review, open the file in an editor that reveals hidden Unicode characters.
Learn more about bidirectional Unicode characters
| # from https://doc.qt.io/qt-5/qtcharts-temperaturerecords-example.html | |
| from PyQt5.QtChart import * | |
| from PyQt5.QtGui import * | |
| from PyQt5.QtCore import * | |
| from PyQt5.QtWidgets import * | |
| a = QApplication([]) | |
| low = QBarSet("Min") | |
| high = QBarSet("Max") | |
| low << -52 << -50 << -45.3 << -37.0 << -25.6 << -8.0 << -6.0 << -11.8 << -19.7 << -32.8 << -43.0 << -48.0 | |
| high << 11.9 << 12.8 << 18.5 << 26.5 << 32.0 << 34.8 << 38.2 << 34.8 << 29.8 << 20.4 << 15.1 << 11.8 | |
| series = QStackedBarSeries() | |
| series.append(low) | |
| series.append(high) | |
| chart = QChart() | |
| chart.addSeries(series) | |
| chart.setTitle("Temperature records in celcius") | |
| chart.setAnimationOptions(QChart.SeriesAnimations) | |
| categories = ["Jan", "Feb", "Mar", "Apr", "May", "Jun", "Jul", "Aug", "Sep", "Oct", "Nov", "Dec"] | |
| axis = QBarCategoryAxis() | |
| axis.append(categories) | |
| axis.setTitleText("Month") | |
| chart.createDefaultAxes() | |
| chart.setAxisX(axis, series) | |
| chart.axisY(series).setRange(-52, 52) | |
| chart.axisY(series).setTitleText("Temperature [°C]") | |
| chart.legend().setVisible(True) | |
| chart.legend().setAlignment(Qt.AlignBottom) | |
| chartView = QChartView(chart) | |
| chartView.setRenderHint(QPainter.Antialiasing) | |
| window = QMainWindow() | |
| window.setCentralWidget(chartView) | |
| window.resize(600, 300) | |
| window.show() | |
| a.exec_() |
Jahirg
commented
Nov 14, 2021
via email
hi,
David, I dont k nokw what library are you using to chart.
Here i put a example how to do chart in matplotlib from csv data.
You can Choose what column is axis x, and what columns do yuu whish put in chart.
Review.
And tell me if that adjust to you need.
JJGM
On Sunday, November 14, 2021, 09:56:02 AM GMT-5, David ***@***.***> wrote:
@hwarang098tkd commented on this gist.
hi. great examples. Is it possible to have a subfunction in order to refresh data? For example: I have a chart with yearly data. I want to update the chart data when I change the item in combobox which include years(2019,2020,2021).
—
You are receiving this because you commented.
Reply to this email directly, view it on GitHub, or unsubscribe.
Triage notifications on the go with GitHub Mobile for iOS or Android.
I use QtChart as your examples.
def chart_one_create(self):
result_oneYear = login_query.connection.login_chart_oneYear(self, widgets.user_tb.text(), widgets.pass_tb.text(), widgets.chart_years_ccb.currentText()) ## just a sql query that brings me the data, it works.
self.set_tkf = QBarSet("TAEKWON-DO")
self.set_fenc = QBarSet("ΞΙΦΑΣΚΙΑ")
self.set_oplo = QBarSet("ΟΠΛΟΜΑΧΙΑ")
self.set_spends = QBarSet("ΕΞΟΔΑ")
for i in range(len(result_oneYear[0])): #modify my sieries .
if result_oneYear[1][i][0] is None:
tkd = 0
else:
tkd = result_oneYear[1][i][0]
self.set_tkf.append(tkd)
if result_oneYear[1][i][1] is None:
fenc = 0
else:
fenc = result_oneYear[1][i][1]
self.set_fenc.append(fenc)
if result_oneYear[1][i][2] is None:
oplo = 0
else:
oplo = result_oneYear[1][i][2]
self.set_oplo.append(oplo)
if result_oneYear[1][i][3] is None:
spen = 0
else:
spen = result_oneYear[1][i][3]
self.set_spends.append(spen)
self.series = QBarSeries()
self.series.append(self.set_tkf)
self.series.append(self.set_fenc)
self.series.append(self.set_oplo)
self.series.append(self.set_spends)
self.categories = result_oneYear[0]
self.chart = QChart()
self.chart.addSeries(self.series)
self.chart.setTitle("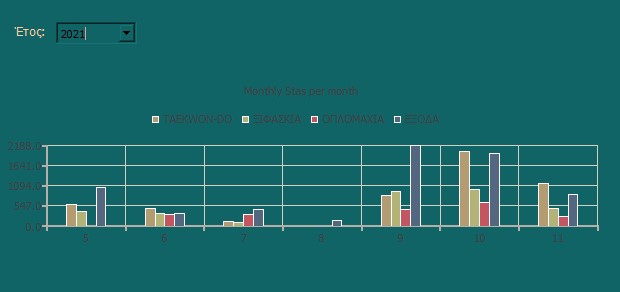")
self.chart.setAnimationOptions(QChart.AllAnimations)
self.chart.setTheme(QChart.ChartThemeBrownSand)
self.chart.setBackgroundBrush(QBrush(QColor("transparent")))
axis = QBarCategoryAxis()
axis.append(self.categories)
self.chart.createDefaultAxes()
self.chart.setAxisX(axis, self.series)
self.chartview = QChartView(self.chart)
vbox = QGridLayout(widgets.chart_one_fm)
vbox.setContentsMargins(0, 0, 0, 0)
vbox.addWidget(self.chartview)
self.update_chart_one()
def update_chart_one(self):
self.series.clear()
???????????????????????
As you can see i have a functional QtChart in my ui and works fine at start up. My problem is when i change the combobox item. I cant figure how to update the data in this chart. I trigger with success my def chart_one_create(self).
thnx

.
Hi...
In the example.. If you see... there is a pushbutton,, first you need take data from combox, then push buttonm to graph.
In your app, you need insert a pushbutton, because you need update chart when you change the period time.
On Sunday, November 14, 2021, 11:25:59 AM GMT-5, David ***@***.***> wrote:
@hwarang098tkd commented on this gist.
I use QtChart as your examples.
def chart_one_create(self):
result_oneYear = login_query.connection.login_chart_oneYear(self, widgets.user_tb.text(), widgets.pass_tb.text(), widgets.chart_years_ccb.currentText()) ## just a sql query that brings me the data, it works.
self.set_tkf = QBarSet("TAEKWON-DO")
self.set_fenc = QBarSet("ΞΙΦΑΣΚΙΑ")
self.set_oplo = QBarSet("ΟΠΛΟΜΑΧΙΑ")
self.set_spends = QBarSet("ΕΞΟΔΑ")
for i in range(len(result_oneYear[0])): #modify my sieries .
if result_oneYear[1][i][0] is None:
tkd = 0
else:
tkd = result_oneYear[1][i][0]
self.set_tkf.append(tkd)
if result_oneYear[1][i][1] is None:
fenc = 0
else:
fenc = result_oneYear[1][i][1]
self.set_fenc.append(fenc)
if result_oneYear[1][i][2] is None:
oplo = 0
else:
oplo = result_oneYear[1][i][2]
self.set_oplo.append(oplo)
if result_oneYear[1][i][3] is None:
spen = 0
else:
spen = result_oneYear[1][i][3]
self.set_spends.append(spen)
self.series = QBarSeries()
self.series.append(self.set_tkf)
self.series.append(self.set_fenc)
self.series.append(self.set_oplo)
self.series.append(self.set_spends)
self.categories = result_oneYear[0]
self.chart = QChart()
self.chart.addSeries(self.series)
self.chart.setTitle("")
self.chart.setAnimationOptions(QChart.AllAnimations)
self.chart.setTheme(QChart.ChartThemeBrownSand)
self.chart.setBackgroundBrush(QBrush(QColor("transparent")))
axis = QBarCategoryAxis()
axis.append(self.categories)
self.chart.createDefaultAxes()
self.chart.setAxisX(axis, self.series)
self.chartview = QChartView(self.chart)
vbox = QGridLayout(widgets.chart_one_fm)
vbox.setContentsMargins(0, 0, 0, 0)
vbox.addWidget(self.chartview)
self.update_chart_one()
def update_chart_one(self):
self.series.clear()
???????????????????????
As you can see i have a functional QtChart in my ui and works fine at start up. My problem is when i change the combobox item. I cant figure how to update the data in this chart. I trigger with success my def chart_one_create(self).
thnx
.
—
You are receiving this because you commented.
Reply to this email directly, view it on GitHub, or unsubscribe.
Triage notifications on the go with GitHub Mobile for iOS or Android.
Sign up for free
to join this conversation on GitHub.
Already have an account?
Sign in to comment