# brief exploratory analysis into fatalities data

library(tidyverse)
#> Loading tidyverse: ggplot2
#> Loading tidyverse: tibble
#> Loading tidyverse: tidyr
#> Loading tidyverse: readr
#> Loading tidyverse: purrr
#> Loading tidyverse: dplyr
#> Warning: package 'dplyr' was built under R version 3.4.2
#> Conflicts with tidy packages ----------------------------------------------
#> filter(): dplyr, stats
#> lag():    dplyr, stats

# dat_fatalities <- readr::read_csv("https://bitre.gov.au/statistics/safety/files/Fatalities_September_2017.csv")

dat_fatal_crash <- readr::read_csv("https://bitre.gov.au/statistics/safety/files/Fatal_Crashes_September_2017.csv") %>%
  janitor::clean_names() %>%
  rename(crash_id = crashid,
         weekday = dayweek) %>%
  mutate(date = anytime::anydate(date))
#> Parsed with column specification:
#> cols(
#>   CrashID = col_double(),
#>   State = col_character(),
#>   Date = col_character(),
#>   Month = col_integer(),
#>   Year = col_integer(),
#>   Dayweek = col_character(),
#>   Time = col_time(format = ""),
#>   Crash_Type = col_character(),
#>   Number_of_Fatalities = col_integer(),
#>   Bus_Involvement = col_character(),
#>   Heavy_Rigid_Truck_Involvement = col_character(),
#>   Articulated_Truck_Involvement = col_character(),
#>   Speed_Limit = col_integer()
#> )

dat_fatal_crash %>%
ggplot(aes(x = date,
           y = number_of_fatalities)) +
  geom_line()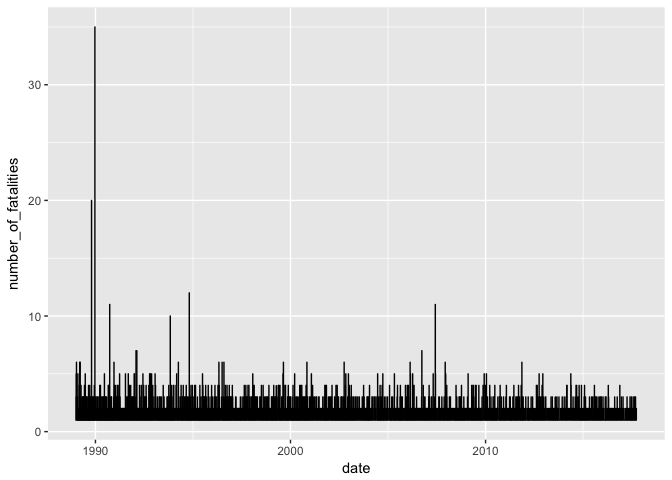
dat_fatal_crash %>%
  group_by(year, state) %>%
  count() %>%
  ggplot(aes(x = year,
             y = n,
             colour = state)) +
geom_line() 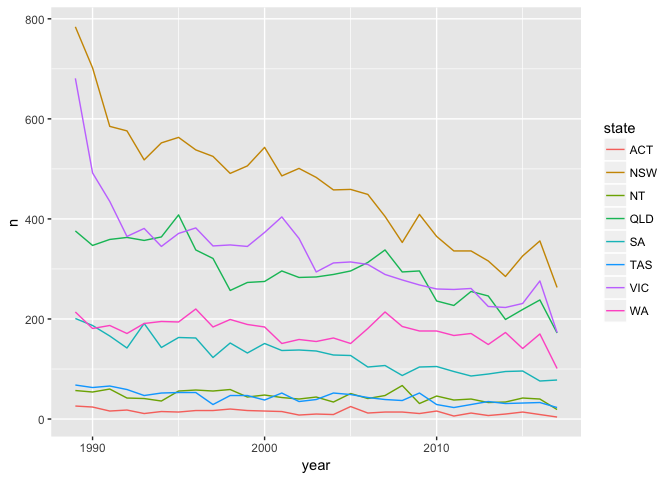
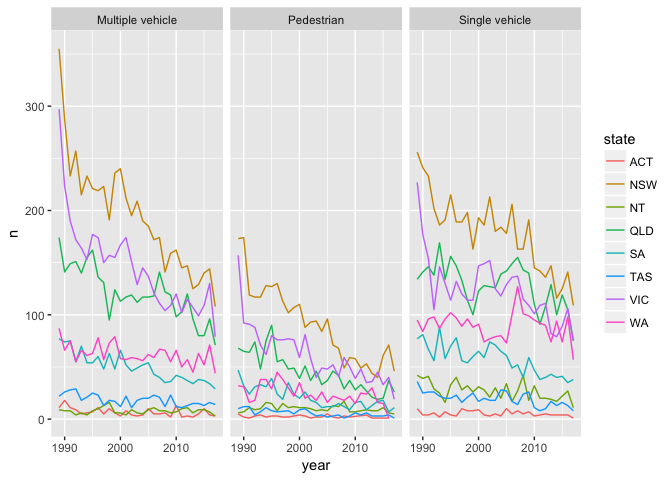
dat_fatal_crash %>%
  group_by(year, state, crash_type) %>%
  count() %>%
  ggplot(aes(x = year,
             y = n,
             colour = state)) +
  geom_line() +
  facet_wrap(~crash_type)