Last active
October 4, 2022 08:13
-
-
Save norecords/85ea0186497404618574a7c62202f304 to your computer and use it in GitHub Desktop.
Highcharts Meteogram for Belchertown skin and Weewx
This file contains bidirectional Unicode text that may be interpreted or compiled differently than what appears below. To review, open the file in an editor that reveals hidden Unicode characters.
Learn more about bidirectional Unicode characters
| <!-- | |
| * | |
| * Highcharts Meteogram for Belchertown skin and Weewx. | |
| * Working with Highstock.js, Dark mode and forecast translations from skin.conf | |
| * Download source code at https://gist.github.com/norecords/85ea0186497404618574a7c62202f304 | |
| * | |
| --> | |
| <div id="meteogram-container"></div> | |
| <script src="https://code.highcharts.com/modules/windbarb.js"></script> | |
| <script src="https://code.highcharts.com/modules/pattern-fill.js"></script> | |
| <script type="text/javascript"> | |
| /** | |
| * From https://www.highcharts.com/demo/combo-meteogram | |
| * This is what it does: | |
| * | |
| * - Loads weather forecast from www.yr.no in form of a JSON service. | |
| * - When the data arrives async, a Meteogram instance is created. We have | |
| * created the Meteogram prototype to provide an organized structure of the | |
| * different methods and subroutines associated with the demo. | |
| * - The parseYrData method parses the data from www.yr.no into several parallel | |
| * arrays. These arrays are used directly as the data option for temperature, | |
| * precipitation and air pressure. | |
| * - After this, the options structure is built, and the chart generated with | |
| * the parsed data. | |
| * - On chart load, weather icons and the frames for the wind arrows are | |
| * rendered using custom logic. | |
| */ | |
| // Edit next line with your latitude, longitude and altitude | |
| const url = 'https://api.met.no/weatherapi/locationforecast/2.0/compact?lat=43.487&lon=6.079&altitude=164'; | |
| // Edit the chart title | |
| const chartText = 'Météogramme pour Correns, France'; | |
| // Edit next line to translate series name in the tooltip | |
| const tooltipSeriesName = ["Temperature", "Precipitation", "Air pressure", "Wind"]; | |
| function Meteogram(json, container) { | |
| // Parallel arrays for the chart data, these are populated as the JSON file | |
| // is loaded | |
| this.symbols = []; | |
| this.precipitations = []; | |
| this.precipitationsError = []; // Only for some data sets | |
| this.winds = []; | |
| this.temperatures = []; | |
| this.pressures = []; | |
| // Initialize | |
| this.json = json; | |
| this.container = container; | |
| // Run | |
| this.parseYrData(); | |
| } | |
| /** | |
| * Mapping of the symbol code in yr.no's API to the icons in their public | |
| * GitHub repo, as well as the text used in the tooltip. | |
| * | |
| * https://api.met.no/weatherapi/weathericon/2.0/documentation | |
| */ | |
| Meteogram.dictionary = { | |
| clearsky: { | |
| symbol: '01', | |
| text: '$obs.label.forecast_cloud_code_CL' | |
| }, | |
| fair: { | |
| symbol: '02', | |
| text: '$obs.label.forecast_cloud_code_FW' | |
| }, | |
| partlycloudy: { | |
| symbol: '03', | |
| text: '$obs.label.forecast_cloud_code_SC' | |
| }, | |
| cloudy: { | |
| symbol: '04', | |
| text: '$obs.label.forecast_cloud_code_OV' | |
| }, | |
| lightrainshowers: { | |
| symbol: '40', | |
| text: '$obs.label.forecast_intensity_code_L $obs.label.forecast_weather_code_RW' | |
| }, | |
| rainshowers: { | |
| symbol: '05', | |
| text: '$obs.label.forecast_weather_code_RW' | |
| }, | |
| heavyrainshowers: { | |
| symbol: '41', | |
| text: '$obs.label.forecast_intensity_code_H $obs.label.forecast_weather_code_RW' | |
| }, | |
| lightrainshowersandthunder: { | |
| symbol: '24', | |
| text: '$obs.label.forecast_intensity_code_L $obs.label.forecast_weather_code_RW / $obs.label.forecast_weather_code_T' | |
| }, | |
| rainshowersandthunder: { | |
| symbol: '06', | |
| text: '$obs.label.forecast_weather_code_RW / $obs.label.forecast_weather_code_T' | |
| }, | |
| heavyrainshowersandthunder: { | |
| symbol: '25', | |
| text: '$obs.label.forecast_intensity_code_H $obs.label.forecast_weather_code_RW / $obs.label.forecast_weather_code_T' | |
| }, | |
| lightsleetshowers: { | |
| symbol: '42', | |
| text: '$obs.label.forecast_intensity_code_L $obs.label.forecast_weather_code_IP' | |
| }, | |
| sleetshowers: { | |
| symbol: '07', | |
| text: '$obs.label.forecast_weather_code_IP' | |
| }, | |
| heavysleetshowers: { | |
| symbol: '43', | |
| text: '$obs.label.forecast_intensity_code_H $obs.label.forecast_weather_code_IP' | |
| }, | |
| lightsleetshowersandthunder: { | |
| symbol: '26', | |
| text: '$obs.label.forecast_intensity_code_L $obs.label.forecast_weather_code_IP $obs.label.forecast_weather_code_T' | |
| }, | |
| sleetshowersandthunder: { | |
| symbol: '20', | |
| text: '$obs.label.forecast_weather_code_IP / $obs.label.forecast_weather_code_T' | |
| }, | |
| heavysleetshowersandthunder: { | |
| symbol: '27', | |
| text: '$obs.label.forecast_intensity_code_H $obs.label.forecast_weather_code_IP / $obs.label.forecast_weather_code_T' | |
| }, | |
| lightsnowshowers: { | |
| symbol: '44', | |
| text: '$obs.label.forecast_intensity_code_L $obs.label.forecast_weather_code_SW' | |
| }, | |
| snowshowers: { | |
| symbol: '08', | |
| text: '$obs.label.forecast_weather_code_SW' | |
| }, | |
| heavysnowshowers: { | |
| symbol: '45', | |
| text: '$obs.label.forecast_intensity_code_H $obs.label.forecast_weather_code_SW' | |
| }, | |
| lightsnowshowersandthunder: { | |
| symbol: '28', | |
| text: '$obs.label.forecast_intensity_code_L $obs.label.forecast_weather_code_SW / $obs.label.forecast_weather_code_T' | |
| }, | |
| snowshowersandthunder: { | |
| symbol: '21', | |
| text: '$obs.label.forecast_weather_code_SW / $obs.label.forecast_weather_code_T' | |
| }, | |
| heavysnowshowersandthunder: { | |
| symbol: '29', | |
| text: '$obs.label.forecast_intensity_code_H $obs.label.forecast_weather_code_SW / $obs.label.forecast_weather_code_T' | |
| }, | |
| lightrain: { | |
| symbol: '46', | |
| text: '$obs.label.forecast_intensity_code_L $obs.label.forecast_weather_code_R' | |
| }, | |
| rain: { | |
| symbol: '09', | |
| text: '$obs.label.forecast_weather_code_R' | |
| }, | |
| heavyrain: { | |
| symbol: '10', | |
| text: '$obs.label.forecast_intensity_code_H $obs.label.forecast_weather_code_R' | |
| }, | |
| lightrainandthunder: { | |
| symbol: '30', | |
| text: '$obs.label.forecast_intensity_code_L $obs.label.forecast_weather_code_R / $obs.label.forecast_weather_code_T' | |
| }, | |
| rainandthunder: { | |
| symbol: '22', | |
| text: '$obs.label.forecast_weather_code_R / $obs.label.forecast_weather_code_T' | |
| }, | |
| heavyrainandthunder: { | |
| symbol: '11', | |
| text: '$obs.label.forecast_intensity_code_H $obs.label.forecast_weather_code_R / $obs.label.forecast_weather_code_T' | |
| }, | |
| lightsleet: { | |
| symbol: '47', | |
| text: '$obs.label.forecast_intensity_code_L $obs.label.forecast_weather_code_IP' | |
| }, | |
| sleet: { | |
| symbol: '12', | |
| text: '$obs.label.forecast_weather_code_IP' | |
| }, | |
| heavysleet: { | |
| symbol: '48', | |
| text: '$obs.label.forecast_intensity_code_H $obs.label.forecast_weather_code_IP' | |
| }, | |
| lightsleetandthunder: { | |
| symbol: '31', | |
| text: '$obs.label.forecast_intensity_code_L $obs.label.forecast_weather_code_IP / $obs.label.forecast_weather_code_T' | |
| }, | |
| sleetandthunder: { | |
| symbol: '23', | |
| text: '$obs.label.forecast_weather_code_IP / $obs.label.forecast_weather_code_T' | |
| }, | |
| heavysleetandthunder: { | |
| symbol: '32', | |
| text: '$obs.label.forecast_intensity_code_H $obs.label.forecast_weather_code_IP / $obs.label.forecast_weather_code_T' | |
| }, | |
| lightsnow: { | |
| symbol: '49', | |
| text: '$obs.label.forecast_intensity_code_L $obs.label.forecast_weather_code_S' | |
| }, | |
| snow: { | |
| symbol: '13', | |
| text: '$obs.label.forecast_weather_code_S' | |
| }, | |
| heavysnow: { | |
| symbol: '50', | |
| text: '$obs.label.forecast_intensity_code_H $obs.label.forecast_weather_code_S' | |
| }, | |
| lightsnowandthunder: { | |
| symbol: '33', | |
| text: '$obs.label.forecast_intensity_code_L $obs.label.forecast_weather_code_S / $obs.label.forecast_weather_code_T' | |
| }, | |
| snowandthunder: { | |
| symbol: '14', | |
| text: '$obs.label.forecast_weather_code_S / $obs.label.forecast_weather_code_T' | |
| }, | |
| heavysnowandthunder: { | |
| symbol: '34', | |
| text: '$obs.label.forecast_intensity_code_H $obs.label.forecast_weather_code_S / $obs.label.forecast_weather_code_T' | |
| }, | |
| fog: { | |
| symbol: '15', | |
| text: '$obs.label.forecast_weather_code_F' | |
| } | |
| }; | |
| /** | |
| * Translate beaufort names | |
| */ | |
| Highcharts.seriesTypes.windbarb.prototype.beaufortName = ["$beaufort0", "$beaufort1", "$beaufort2", "$beaufort3", | |
| "$beaufort4", "$beaufort5", "$beaufort6", "$beaufort7", "$beaufort9", "$beaufort10","$beaufort11", "$beaufort12"]; | |
| /** | |
| * Draw the weather symbols on top of the temperature series. The symbols are | |
| * fetched from yr.no's MIT licensed weather symbol collection. | |
| * https://github.com/YR/weather-symbols | |
| */ | |
| Meteogram.prototype.drawWeatherSymbols = function (chart) { | |
| chart.series[0].data.forEach((point, i) => { | |
| if (this.resolution > 36e5 || i % 2 === 0) { | |
| const [symbol, specifier] = this.symbols[i].split('_'), | |
| icon = Meteogram.dictionary[symbol].symbol + | |
| ({ day: 'd', night: 'n' }[specifier] || ''); | |
| if (Meteogram.dictionary[symbol]) { | |
| chart.renderer | |
| .image( | |
| 'https://cdn.jsdelivr.net/gh/nrkno/yr-weather-symbols' + | |
| `@8.0.1/dist/svg/` + icon + `.svg`, | |
| point.plotX + chart.plotLeft - 8, | |
| point.plotY + chart.plotTop - 35, | |
| 30, | |
| 30 | |
| ) | |
| .attr({ | |
| zIndex: 5 | |
| }) | |
| .add(); | |
| } else { | |
| console.log(symbol); | |
| } | |
| } | |
| }); | |
| }; | |
| /** | |
| * Draw blocks around wind arrows, below the plot area | |
| */ | |
| Meteogram.prototype.drawBlocksForWindArrows = function (chart) { | |
| const xAxis = chart.xAxis[0]; | |
| for ( | |
| let pos = xAxis.min, max = xAxis.max, i = 0; | |
| pos <= max + 36e5; pos += 36e5, | |
| i += 1 | |
| ) { | |
| // Get the X position | |
| const isLast = pos === max + 36e5, | |
| x = Math.round(xAxis.toPixels(pos)) + (isLast ? 0.5 : -0.5); | |
| // Draw the vertical dividers and ticks | |
| const isLong = this.resolution > 36e5 ? | |
| pos % this.resolution === 0 : | |
| i % 2 === 0; | |
| chart.renderer | |
| .path([ | |
| 'M', x, chart.plotTop + chart.plotHeight + (isLong ? 0 : 28), | |
| 'L', x, chart.plotTop + chart.plotHeight + 32, | |
| 'Z' | |
| ]) | |
| .attr({ | |
| stroke: chart.options.chart.plotBorderColor, | |
| 'stroke-width': 1 | |
| }) | |
| .add(); | |
| } | |
| // Center items in block | |
| chart.get('windbarbs').markerGroup.attr({ | |
| translateX: chart.get('windbarbs').markerGroup.translateX + 8 | |
| }); | |
| }; | |
| /** | |
| * Build and return the Highcharts options structure | |
| */ | |
| Meteogram.prototype.getChartOptions = function () { | |
| return { | |
| chart: { | |
| renderTo: this.container, | |
| marginBottom: 70, | |
| marginRight: 40, | |
| marginTop: 50, | |
| plotBorderWidth: 1, | |
| width: 1100, | |
| height: 310, | |
| alignTicks: false | |
| }, | |
| defs: { | |
| patterns: [{ | |
| id: 'precipitation-error', | |
| path: { | |
| d: [ | |
| 'M', 3.3, 0, 'L', -6.7, 10, | |
| 'M', 6.7, 0, 'L', -3.3, 10, | |
| 'M', 10, 0, 'L', 0, 10, | |
| 'M', 13.3, 0, 'L', 3.3, 10, | |
| 'M', 16.7, 0, 'L', 6.7, 10 | |
| ].join(' '), | |
| stroke: '#68CFE8', | |
| strokeWidth: 1 | |
| } | |
| }] | |
| }, | |
| title: { | |
| text: chartText, | |
| align: 'left', | |
| style: { | |
| whiteSpace: 'nowrap', | |
| textOverflow: 'ellipsis' | |
| } | |
| }, | |
| credits: { | |
| text: 'Forecast from <a href="https://yr.no">yr.no</a>', | |
| href: 'https://yr.no', | |
| position: { | |
| x: -40 | |
| } | |
| }, | |
| tooltip: { | |
| shared: true, | |
| useHTML: true, | |
| headerFormat: | |
| '<small>{point.x:%A %e %b, %H:%M} - {point.to:%H:%M}</small><br>' + | |
| '<b>{point.symbolName}</b><br>' | |
| }, | |
| exporting: { | |
| enabled: false | |
| }, | |
| xAxis: [{ // Bottom X axis | |
| type: 'datetime', | |
| tickInterval: 2 * 36e5, // two hours | |
| minorTickInterval: 36e5, // one hour | |
| tickLength: 0, | |
| gridLineWidth: 1, | |
| gridLineColor: 'rgba(128, 128, 128, 0.1)', | |
| startOnTick: false, | |
| endOnTick: false, | |
| minPadding: 0, | |
| maxPadding: 0, | |
| offset: 30, | |
| showLastLabel: true, | |
| labels: { | |
| format: '{value:%H}' | |
| }, | |
| crosshair: true | |
| }, { // Top X axis | |
| linkedTo: 0, | |
| type: 'datetime', | |
| tickInterval: 24 * 3600 * 1000, | |
| labels: { | |
| format: '{value:<span style="font-size: 12px; font-weight: bold">%a</span> %e %b}', | |
| align: 'left', | |
| x: 3, | |
| y: 5 | |
| }, | |
| opposite: true, | |
| tickLength: 20, | |
| gridLineWidth: 1 | |
| }], | |
| yAxis: [{ // temperature axis | |
| title: { | |
| text: '$unit.label.outTemp', | |
| offset: 0, | |
| align: 'high', | |
| rotation: 0, | |
| style: { | |
| fontSize: '12px', | |
| }, | |
| textAlign: 'left', | |
| x: -17, | |
| y: 2 | |
| }, | |
| labels: { | |
| style: { | |
| fontSize: '10px' | |
| }, | |
| x: -5 | |
| }, | |
| plotLines: [{ // zero plane | |
| value: 0, | |
| color: '#BBBBBB', | |
| width: 1, | |
| zIndex: 3 | |
| }], | |
| maxPadding: 0.3, | |
| minRange: 8, | |
| tickInterval: 1, | |
| gridLineColor: 'rgba(128, 128, 128, 0.1)', | |
| showLastLabel: false | |
| }, { // precipitation axis | |
| title: { | |
| text: null | |
| }, | |
| labels: { | |
| enabled: false | |
| }, | |
| className: 'dark-gridline', | |
| gridLineWidth: 0, | |
| tickLength: 0, | |
| minRange: 10, | |
| min: 0 | |
| }, { // Air pressure | |
| allowDecimals: false, | |
| title: { // Title on top of axis | |
| text: 'hPa', | |
| offset: 0, | |
| align: 'high', | |
| rotation: 0, | |
| style: { | |
| fontSize: '12px', | |
| }, | |
| textAlign: 'left', | |
| x: 5 | |
| }, | |
| labels: { | |
| style: { | |
| fontSize: '8px', | |
| }, | |
| y: 2, | |
| x: 5 | |
| }, | |
| className: 'dark-gridline', | |
| gridLineWidth: 0, | |
| opposite: true, | |
| showLastLabel: false | |
| }], | |
| legend: { | |
| enabled: false | |
| }, | |
| plotOptions: { | |
| series: { | |
| pointPlacement: 'between', | |
| states: { | |
| inactive: { | |
| enabled: false | |
| } | |
| } | |
| } | |
| }, | |
| series: [{ | |
| name: tooltipSeriesName[0], | |
| data: this.temperatures, | |
| type: 'spline', | |
| marker: { | |
| enabled: false, | |
| states: { | |
| hover: { | |
| enabled: true | |
| } | |
| } | |
| }, | |
| tooltip: { | |
| pointFormat: '<span style="color:{point.color}">\u25CF</span> ' + | |
| '{series.name}: <b>{point.y}°C</b><br/>' | |
| }, | |
| zIndex: 1, | |
| color: '#FF3333', | |
| negativeColor: '#48AFE8' | |
| }, { | |
| name: tooltipSeriesName[1], | |
| data: this.precipitationsError, | |
| type: 'column', | |
| color: 'url(#precipitation-error)', | |
| yAxis: 1, | |
| groupPadding: 0, | |
| pointPadding: 0, | |
| tooltip: { | |
| valueSuffix: ' mm', | |
| pointFormat: '<span style="color:{point.color}">\u25CF</span> ' + | |
| '{series.name}: <b>{point.minvalue} mm - {point.maxvalue} mm</b><br/>' | |
| }, | |
| grouping: false, | |
| dataLabels: { | |
| enabled: this.hasPrecipitationError, | |
| filter: { | |
| operator: '>', | |
| property: 'maxValue', | |
| value: 0 | |
| }, | |
| style: { | |
| fontSize: '8px', | |
| color: 'gray' | |
| } | |
| } | |
| }, { | |
| name: tooltipSeriesName[1], | |
| data: this.precipitations, | |
| type: 'column', | |
| color: '#68CFE8', | |
| yAxis: 1, | |
| groupPadding: 0, | |
| pointPadding: 0, | |
| grouping: false, | |
| dataLabels: { | |
| enabled: !this.hasPrecipitationError, | |
| filter: { | |
| operator: '>', | |
| property: 'y', | |
| value: 0 | |
| }, | |
| style: { | |
| fontSize: '8px', | |
| color: 'gray' | |
| } | |
| }, | |
| tooltip: { | |
| valueSuffix: ' mm' | |
| } | |
| }, { | |
| name: tooltipSeriesName[2], | |
| color: Highcharts.getOptions().colors[2], | |
| data: this.pressures, | |
| marker: { | |
| enabled: false | |
| }, | |
| shadow: false, | |
| tooltip: { | |
| valueSuffix: ' hPa' | |
| }, | |
| dashStyle: 'shortdot', | |
| yAxis: 2 | |
| }, { | |
| name: tooltipSeriesName[3], | |
| type: 'windbarb', | |
| id: 'windbarbs', | |
| color: '#db6600', | |
| lineWidth: 1.5, | |
| data: this.winds, | |
| vectorLength: 18, | |
| yOffset: -15, | |
| tooltip: { | |
| #if $unit.unit_type.windSpeed == 'km_per_hour' | |
| // Convert wind speed m/s to km/h in the tooltip | |
| valueDecimals: 4, | |
| pointFormatter: function() { | |
| return ( | |
| '<span style="color:' + this.series.color + '">\u25CF</span> ' | |
| + this.series.name + ': <b>' + Math.round(this.value * 3.6) + ' km/h</b> ' | |
| + '(' + this.beaufort + ')<br/>' | |
| ); | |
| } | |
| #elif $unit.unit_type.windSpeed == 'mile_per_hour' | |
| // Convert wind speed m/s to mph in the tooltip | |
| valueDecimals: 4, | |
| pointFormatter: function() { | |
| return ( | |
| '<span style="color:' + this.series.color + '">\u25CF</span> ' | |
| + this.series.name + ': <b>' + Math.round(this.value * 2.237) + ' mph</b> ' | |
| + '(' + this.beaufort + ')<br/>' | |
| ); | |
| } | |
| #elif $unit.unit_type.windSpeed == 'knot' | |
| // Convert wind speed m/s to knot in the tooltip | |
| valueDecimals: 4, | |
| pointFormatter: function() { | |
| return ( | |
| '<span style="color:' + this.series.color + '">\u25CF</span> ' | |
| + this.series.name + ': <b>' + Math.round(this.value * 1.94384) + ' knt</b> ' | |
| + '(' + this.beaufort + ')<br/>' | |
| ); | |
| } | |
| #else | |
| // Default | |
| valueSuffix: ' m/s' | |
| #end if | |
| } | |
| }] | |
| }; | |
| }; | |
| /** | |
| * Post-process the chart from the callback function, the second argument | |
| * Highcharts.Chart. | |
| */ | |
| Meteogram.prototype.onChartLoad = function (chart) { | |
| this.drawWeatherSymbols(chart); | |
| this.drawBlocksForWindArrows(chart); | |
| }; | |
| /** | |
| * Create the chart. This function is called async when the data file is loaded | |
| * and parsed. | |
| */ | |
| Meteogram.prototype.createChart = function () { | |
| this.chart = new Highcharts.Chart(this.getChartOptions(), chart => { | |
| this.onChartLoad(chart); | |
| }); | |
| }; | |
| Meteogram.prototype.error = function () { | |
| document.getElementById('loading').innerHTML = | |
| '<i class="fa fa-frown-o"></i> Failed loading data, please try again later'; | |
| }; | |
| /** | |
| * Handle the data. This part of the code is not Highcharts specific, but deals | |
| * with yr.no's specific data format | |
| */ | |
| Meteogram.prototype.parseYrData = function () { | |
| let pointStart; | |
| if (!this.json) { | |
| return this.error(); | |
| } | |
| // Loop over hourly (or 6-hourly) forecasts | |
| this.json.properties.timeseries.forEach((node, i) => { | |
| const x = Date.parse(node.time), | |
| nextHours = node.data.next_1_hours || node.data.next_6_hours, | |
| symbolCode = nextHours && nextHours.summary.symbol_code, | |
| to = node.data.next_1_hours ? x + 36e5 : x + 6 * 36e5; | |
| if (to > pointStart + 48 * 36e5) { | |
| return; | |
| } | |
| // Populate the parallel arrays | |
| this.symbols.push(nextHours.summary.symbol_code); | |
| this.temperatures.push({ | |
| x, | |
| y: node.data.instant.details.air_temperature, | |
| // custom options used in the tooltip formatter | |
| to, | |
| symbolName: Meteogram.dictionary[ | |
| symbolCode.replace(/_(day|night)$/, '') | |
| ].text | |
| }); | |
| this.precipitations.push({ | |
| x, | |
| y: nextHours.details.precipitation_amount | |
| }); | |
| if (i % 2 === 0) { | |
| this.winds.push({ | |
| x, | |
| value: node.data.instant.details.wind_speed, | |
| direction: node.data.instant.details.wind_from_direction | |
| }); | |
| } | |
| this.pressures.push({ | |
| x, | |
| y: node.data.instant.details.air_pressure_at_sea_level | |
| }); | |
| if (i === 0) { | |
| pointStart = (x + to) / 2; | |
| } | |
| }); | |
| // Create the chart when the data is loaded | |
| this.createChart(); | |
| }; | |
| // End of the Meteogram protype | |
| // On DOM ready... | |
| window.addEventListener("DOMContentLoaded", (event) => { | |
| Highcharts.ajax({ | |
| url, | |
| dataType: 'json', | |
| success: json => { | |
| window.meteogram = new Meteogram(json, 'meteogram-container'); | |
| }, | |
| error: Meteogram.prototype.error, | |
| headers: { | |
| // Override the Content-Type to avoid preflight problems with CORS | |
| 'Content-Type': 'text/plain' | |
| } | |
| }); | |
| }); | |
| </script> | |
| <style type="text/css"> | |
| #meteogram-container { | |
| min-width: 340px; | |
| max-width: 1100px; | |
| height: 310px; | |
| margin: 10px auto 10px auto; | |
| overflow-x: auto !important; | |
| } | |
| #meteogram-container .highcharts-text-outline { | |
| stroke: #ffffff; | |
| } | |
| .dark #meteogram-container .highcharts-point { | |
| stroke-width: 1.5px; | |
| } | |
| .dark #meteogram-container .highcharts-text-outline, | |
| .dark #meteogram-container .highcharts-yaxis-grid.dark-gridline path { | |
| stroke:transparent !important; | |
| } | |
| </style> |
@dtalens that have been fixed on the last rev https://gist.github.com/norecords/85ea0186497404618574a7c62202f304/revisions#diff-ec09dffc558368608407d7edb446419b262fad1a433a261cc29c60f34783df12
That because of new Highcharts version.
Add that to your css rules:
#meteogram-container .highcharts-text-outline {
  stroke: #ffffff;
}
Also
in // Top X axis section
at line 402 change
y: -5
to
y: 5
@Millardiang @steepleian you can load your Meteocon icon set like that:
replace
      if (Meteogram.dictionary[symbol]) {
        chart.renderer
          .image(
            'https://cdn.jsdelivr.net/gh/nrkno/yr-weather-symbols' +
              `@8.0.1/dist/svg/` + icon + `.svg`,
            point.plotX + chart.plotLeft - 8,
            point.plotY + chart.plotTop - 35,
            30,
            30
          )
by
      if (Meteogram.dictionary[symbol]) {
        chart.renderer
          .image(
            'https://cdn.jsdelivr.net/gh/steepleian/MeteoconsYR@master/' + icon + '.svg',
            point.plotX + chart.plotLeft - 8,
            point.plotY + chart.plotTop - 40,
            35,
            35
          )
that way you use external geo localized cdn from jsdelivr :)
you forgot to edit this line with your latitude, longitude and altitude
// Edit next line with your latitude, longitude and altitude
const url = 'https://api.met.no/weatherapi/locationforecast/2.0/compact?lat=43.487&lon=6.079&altitude=164';
on your meteogram you use mine...
you forgot to edit this line with your latitude, longitude and altitude
// Edit next line with your latitude, longitude and altitude
const url = 'https://api.met.no/weatherapi/locationforecast/2.0/compact?lat=43.487&lon=6.079&altitude=164';
on your meteogram you use mine...
Uppss thnaks @norecords
Sign up for free
to join this conversation on GitHub.
Already have an account?
Sign in to comment
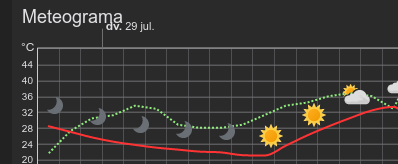
Ei, today in my meteogram rain numbers appear as shown in this image:
Is this normal?