-
-
Save norecords/85ea0186497404618574a7c62202f304 to your computer and use it in GitHub Desktop.
| <!-- | |
| * | |
| * Highcharts Meteogram for Belchertown skin and Weewx. | |
| * Working with Highstock.js, Dark mode and forecast translations from skin.conf | |
| * Download source code at https://gist.github.com/norecords/85ea0186497404618574a7c62202f304 | |
| * | |
| --> | |
| <div id="meteogram-container"></div> | |
| <script src="https://code.highcharts.com/modules/windbarb.js"></script> | |
| <script src="https://code.highcharts.com/modules/pattern-fill.js"></script> | |
| <script type="text/javascript"> | |
| /** | |
| * From https://www.highcharts.com/demo/combo-meteogram | |
| * This is what it does: | |
| * | |
| * - Loads weather forecast from www.yr.no in form of a JSON service. | |
| * - When the data arrives async, a Meteogram instance is created. We have | |
| * created the Meteogram prototype to provide an organized structure of the | |
| * different methods and subroutines associated with the demo. | |
| * - The parseYrData method parses the data from www.yr.no into several parallel | |
| * arrays. These arrays are used directly as the data option for temperature, | |
| * precipitation and air pressure. | |
| * - After this, the options structure is built, and the chart generated with | |
| * the parsed data. | |
| * - On chart load, weather icons and the frames for the wind arrows are | |
| * rendered using custom logic. | |
| */ | |
| // Edit next line with your latitude, longitude and altitude | |
| const url = 'https://api.met.no/weatherapi/locationforecast/2.0/compact?lat=43.487&lon=6.079&altitude=164'; | |
| // Edit the chart title | |
| const chartText = 'Météogramme pour Correns, France'; | |
| // Edit next line to translate series name in the tooltip | |
| const tooltipSeriesName = ["Temperature", "Precipitation", "Air pressure", "Wind"]; | |
| function Meteogram(json, container) { | |
| // Parallel arrays for the chart data, these are populated as the JSON file | |
| // is loaded | |
| this.symbols = []; | |
| this.precipitations = []; | |
| this.precipitationsError = []; // Only for some data sets | |
| this.winds = []; | |
| this.temperatures = []; | |
| this.pressures = []; | |
| // Initialize | |
| this.json = json; | |
| this.container = container; | |
| // Run | |
| this.parseYrData(); | |
| } | |
| /** | |
| * Mapping of the symbol code in yr.no's API to the icons in their public | |
| * GitHub repo, as well as the text used in the tooltip. | |
| * | |
| * https://api.met.no/weatherapi/weathericon/2.0/documentation | |
| */ | |
| Meteogram.dictionary = { | |
| clearsky: { | |
| symbol: '01', | |
| text: '$obs.label.forecast_cloud_code_CL' | |
| }, | |
| fair: { | |
| symbol: '02', | |
| text: '$obs.label.forecast_cloud_code_FW' | |
| }, | |
| partlycloudy: { | |
| symbol: '03', | |
| text: '$obs.label.forecast_cloud_code_SC' | |
| }, | |
| cloudy: { | |
| symbol: '04', | |
| text: '$obs.label.forecast_cloud_code_OV' | |
| }, | |
| lightrainshowers: { | |
| symbol: '40', | |
| text: '$obs.label.forecast_intensity_code_L $obs.label.forecast_weather_code_RW' | |
| }, | |
| rainshowers: { | |
| symbol: '05', | |
| text: '$obs.label.forecast_weather_code_RW' | |
| }, | |
| heavyrainshowers: { | |
| symbol: '41', | |
| text: '$obs.label.forecast_intensity_code_H $obs.label.forecast_weather_code_RW' | |
| }, | |
| lightrainshowersandthunder: { | |
| symbol: '24', | |
| text: '$obs.label.forecast_intensity_code_L $obs.label.forecast_weather_code_RW / $obs.label.forecast_weather_code_T' | |
| }, | |
| rainshowersandthunder: { | |
| symbol: '06', | |
| text: '$obs.label.forecast_weather_code_RW / $obs.label.forecast_weather_code_T' | |
| }, | |
| heavyrainshowersandthunder: { | |
| symbol: '25', | |
| text: '$obs.label.forecast_intensity_code_H $obs.label.forecast_weather_code_RW / $obs.label.forecast_weather_code_T' | |
| }, | |
| lightsleetshowers: { | |
| symbol: '42', | |
| text: '$obs.label.forecast_intensity_code_L $obs.label.forecast_weather_code_IP' | |
| }, | |
| sleetshowers: { | |
| symbol: '07', | |
| text: '$obs.label.forecast_weather_code_IP' | |
| }, | |
| heavysleetshowers: { | |
| symbol: '43', | |
| text: '$obs.label.forecast_intensity_code_H $obs.label.forecast_weather_code_IP' | |
| }, | |
| lightsleetshowersandthunder: { | |
| symbol: '26', | |
| text: '$obs.label.forecast_intensity_code_L $obs.label.forecast_weather_code_IP $obs.label.forecast_weather_code_T' | |
| }, | |
| sleetshowersandthunder: { | |
| symbol: '20', | |
| text: '$obs.label.forecast_weather_code_IP / $obs.label.forecast_weather_code_T' | |
| }, | |
| heavysleetshowersandthunder: { | |
| symbol: '27', | |
| text: '$obs.label.forecast_intensity_code_H $obs.label.forecast_weather_code_IP / $obs.label.forecast_weather_code_T' | |
| }, | |
| lightsnowshowers: { | |
| symbol: '44', | |
| text: '$obs.label.forecast_intensity_code_L $obs.label.forecast_weather_code_SW' | |
| }, | |
| snowshowers: { | |
| symbol: '08', | |
| text: '$obs.label.forecast_weather_code_SW' | |
| }, | |
| heavysnowshowers: { | |
| symbol: '45', | |
| text: '$obs.label.forecast_intensity_code_H $obs.label.forecast_weather_code_SW' | |
| }, | |
| lightsnowshowersandthunder: { | |
| symbol: '28', | |
| text: '$obs.label.forecast_intensity_code_L $obs.label.forecast_weather_code_SW / $obs.label.forecast_weather_code_T' | |
| }, | |
| snowshowersandthunder: { | |
| symbol: '21', | |
| text: '$obs.label.forecast_weather_code_SW / $obs.label.forecast_weather_code_T' | |
| }, | |
| heavysnowshowersandthunder: { | |
| symbol: '29', | |
| text: '$obs.label.forecast_intensity_code_H $obs.label.forecast_weather_code_SW / $obs.label.forecast_weather_code_T' | |
| }, | |
| lightrain: { | |
| symbol: '46', | |
| text: '$obs.label.forecast_intensity_code_L $obs.label.forecast_weather_code_R' | |
| }, | |
| rain: { | |
| symbol: '09', | |
| text: '$obs.label.forecast_weather_code_R' | |
| }, | |
| heavyrain: { | |
| symbol: '10', | |
| text: '$obs.label.forecast_intensity_code_H $obs.label.forecast_weather_code_R' | |
| }, | |
| lightrainandthunder: { | |
| symbol: '30', | |
| text: '$obs.label.forecast_intensity_code_L $obs.label.forecast_weather_code_R / $obs.label.forecast_weather_code_T' | |
| }, | |
| rainandthunder: { | |
| symbol: '22', | |
| text: '$obs.label.forecast_weather_code_R / $obs.label.forecast_weather_code_T' | |
| }, | |
| heavyrainandthunder: { | |
| symbol: '11', | |
| text: '$obs.label.forecast_intensity_code_H $obs.label.forecast_weather_code_R / $obs.label.forecast_weather_code_T' | |
| }, | |
| lightsleet: { | |
| symbol: '47', | |
| text: '$obs.label.forecast_intensity_code_L $obs.label.forecast_weather_code_IP' | |
| }, | |
| sleet: { | |
| symbol: '12', | |
| text: '$obs.label.forecast_weather_code_IP' | |
| }, | |
| heavysleet: { | |
| symbol: '48', | |
| text: '$obs.label.forecast_intensity_code_H $obs.label.forecast_weather_code_IP' | |
| }, | |
| lightsleetandthunder: { | |
| symbol: '31', | |
| text: '$obs.label.forecast_intensity_code_L $obs.label.forecast_weather_code_IP / $obs.label.forecast_weather_code_T' | |
| }, | |
| sleetandthunder: { | |
| symbol: '23', | |
| text: '$obs.label.forecast_weather_code_IP / $obs.label.forecast_weather_code_T' | |
| }, | |
| heavysleetandthunder: { | |
| symbol: '32', | |
| text: '$obs.label.forecast_intensity_code_H $obs.label.forecast_weather_code_IP / $obs.label.forecast_weather_code_T' | |
| }, | |
| lightsnow: { | |
| symbol: '49', | |
| text: '$obs.label.forecast_intensity_code_L $obs.label.forecast_weather_code_S' | |
| }, | |
| snow: { | |
| symbol: '13', | |
| text: '$obs.label.forecast_weather_code_S' | |
| }, | |
| heavysnow: { | |
| symbol: '50', | |
| text: '$obs.label.forecast_intensity_code_H $obs.label.forecast_weather_code_S' | |
| }, | |
| lightsnowandthunder: { | |
| symbol: '33', | |
| text: '$obs.label.forecast_intensity_code_L $obs.label.forecast_weather_code_S / $obs.label.forecast_weather_code_T' | |
| }, | |
| snowandthunder: { | |
| symbol: '14', | |
| text: '$obs.label.forecast_weather_code_S / $obs.label.forecast_weather_code_T' | |
| }, | |
| heavysnowandthunder: { | |
| symbol: '34', | |
| text: '$obs.label.forecast_intensity_code_H $obs.label.forecast_weather_code_S / $obs.label.forecast_weather_code_T' | |
| }, | |
| fog: { | |
| symbol: '15', | |
| text: '$obs.label.forecast_weather_code_F' | |
| } | |
| }; | |
| /** | |
| * Translate beaufort names | |
| */ | |
| Highcharts.seriesTypes.windbarb.prototype.beaufortName = ["$beaufort0", "$beaufort1", "$beaufort2", "$beaufort3", | |
| "$beaufort4", "$beaufort5", "$beaufort6", "$beaufort7", "$beaufort9", "$beaufort10","$beaufort11", "$beaufort12"]; | |
| /** | |
| * Draw the weather symbols on top of the temperature series. The symbols are | |
| * fetched from yr.no's MIT licensed weather symbol collection. | |
| * https://github.com/YR/weather-symbols | |
| */ | |
| Meteogram.prototype.drawWeatherSymbols = function (chart) { | |
| chart.series[0].data.forEach((point, i) => { | |
| if (this.resolution > 36e5 || i % 2 === 0) { | |
| const [symbol, specifier] = this.symbols[i].split('_'), | |
| icon = Meteogram.dictionary[symbol].symbol + | |
| ({ day: 'd', night: 'n' }[specifier] || ''); | |
| if (Meteogram.dictionary[symbol]) { | |
| chart.renderer | |
| .image( | |
| 'https://cdn.jsdelivr.net/gh/nrkno/yr-weather-symbols' + | |
| `@8.0.1/dist/svg/` + icon + `.svg`, | |
| point.plotX + chart.plotLeft - 8, | |
| point.plotY + chart.plotTop - 35, | |
| 30, | |
| 30 | |
| ) | |
| .attr({ | |
| zIndex: 5 | |
| }) | |
| .add(); | |
| } else { | |
| console.log(symbol); | |
| } | |
| } | |
| }); | |
| }; | |
| /** | |
| * Draw blocks around wind arrows, below the plot area | |
| */ | |
| Meteogram.prototype.drawBlocksForWindArrows = function (chart) { | |
| const xAxis = chart.xAxis[0]; | |
| for ( | |
| let pos = xAxis.min, max = xAxis.max, i = 0; | |
| pos <= max + 36e5; pos += 36e5, | |
| i += 1 | |
| ) { | |
| // Get the X position | |
| const isLast = pos === max + 36e5, | |
| x = Math.round(xAxis.toPixels(pos)) + (isLast ? 0.5 : -0.5); | |
| // Draw the vertical dividers and ticks | |
| const isLong = this.resolution > 36e5 ? | |
| pos % this.resolution === 0 : | |
| i % 2 === 0; | |
| chart.renderer | |
| .path([ | |
| 'M', x, chart.plotTop + chart.plotHeight + (isLong ? 0 : 28), | |
| 'L', x, chart.plotTop + chart.plotHeight + 32, | |
| 'Z' | |
| ]) | |
| .attr({ | |
| stroke: chart.options.chart.plotBorderColor, | |
| 'stroke-width': 1 | |
| }) | |
| .add(); | |
| } | |
| // Center items in block | |
| chart.get('windbarbs').markerGroup.attr({ | |
| translateX: chart.get('windbarbs').markerGroup.translateX + 8 | |
| }); | |
| }; | |
| /** | |
| * Build and return the Highcharts options structure | |
| */ | |
| Meteogram.prototype.getChartOptions = function () { | |
| return { | |
| chart: { | |
| renderTo: this.container, | |
| marginBottom: 70, | |
| marginRight: 40, | |
| marginTop: 50, | |
| plotBorderWidth: 1, | |
| width: 1100, | |
| height: 310, | |
| alignTicks: false | |
| }, | |
| defs: { | |
| patterns: [{ | |
| id: 'precipitation-error', | |
| path: { | |
| d: [ | |
| 'M', 3.3, 0, 'L', -6.7, 10, | |
| 'M', 6.7, 0, 'L', -3.3, 10, | |
| 'M', 10, 0, 'L', 0, 10, | |
| 'M', 13.3, 0, 'L', 3.3, 10, | |
| 'M', 16.7, 0, 'L', 6.7, 10 | |
| ].join(' '), | |
| stroke: '#68CFE8', | |
| strokeWidth: 1 | |
| } | |
| }] | |
| }, | |
| title: { | |
| text: chartText, | |
| align: 'left', | |
| style: { | |
| whiteSpace: 'nowrap', | |
| textOverflow: 'ellipsis' | |
| } | |
| }, | |
| credits: { | |
| text: 'Forecast from <a href="https://yr.no">yr.no</a>', | |
| href: 'https://yr.no', | |
| position: { | |
| x: -40 | |
| } | |
| }, | |
| tooltip: { | |
| shared: true, | |
| useHTML: true, | |
| headerFormat: | |
| '<small>{point.x:%A %e %b, %H:%M} - {point.to:%H:%M}</small><br>' + | |
| '<b>{point.symbolName}</b><br>' | |
| }, | |
| exporting: { | |
| enabled: false | |
| }, | |
| xAxis: [{ // Bottom X axis | |
| type: 'datetime', | |
| tickInterval: 2 * 36e5, // two hours | |
| minorTickInterval: 36e5, // one hour | |
| tickLength: 0, | |
| gridLineWidth: 1, | |
| gridLineColor: 'rgba(128, 128, 128, 0.1)', | |
| startOnTick: false, | |
| endOnTick: false, | |
| minPadding: 0, | |
| maxPadding: 0, | |
| offset: 30, | |
| showLastLabel: true, | |
| labels: { | |
| format: '{value:%H}' | |
| }, | |
| crosshair: true | |
| }, { // Top X axis | |
| linkedTo: 0, | |
| type: 'datetime', | |
| tickInterval: 24 * 3600 * 1000, | |
| labels: { | |
| format: '{value:<span style="font-size: 12px; font-weight: bold">%a</span> %e %b}', | |
| align: 'left', | |
| x: 3, | |
| y: 5 | |
| }, | |
| opposite: true, | |
| tickLength: 20, | |
| gridLineWidth: 1 | |
| }], | |
| yAxis: [{ // temperature axis | |
| title: { | |
| text: '$unit.label.outTemp', | |
| offset: 0, | |
| align: 'high', | |
| rotation: 0, | |
| style: { | |
| fontSize: '12px', | |
| }, | |
| textAlign: 'left', | |
| x: -17, | |
| y: 2 | |
| }, | |
| labels: { | |
| style: { | |
| fontSize: '10px' | |
| }, | |
| x: -5 | |
| }, | |
| plotLines: [{ // zero plane | |
| value: 0, | |
| color: '#BBBBBB', | |
| width: 1, | |
| zIndex: 3 | |
| }], | |
| maxPadding: 0.3, | |
| minRange: 8, | |
| tickInterval: 1, | |
| gridLineColor: 'rgba(128, 128, 128, 0.1)', | |
| showLastLabel: false | |
| }, { // precipitation axis | |
| title: { | |
| text: null | |
| }, | |
| labels: { | |
| enabled: false | |
| }, | |
| className: 'dark-gridline', | |
| gridLineWidth: 0, | |
| tickLength: 0, | |
| minRange: 10, | |
| min: 0 | |
| }, { // Air pressure | |
| allowDecimals: false, | |
| title: { // Title on top of axis | |
| text: 'hPa', | |
| offset: 0, | |
| align: 'high', | |
| rotation: 0, | |
| style: { | |
| fontSize: '12px', | |
| }, | |
| textAlign: 'left', | |
| x: 5 | |
| }, | |
| labels: { | |
| style: { | |
| fontSize: '8px', | |
| }, | |
| y: 2, | |
| x: 5 | |
| }, | |
| className: 'dark-gridline', | |
| gridLineWidth: 0, | |
| opposite: true, | |
| showLastLabel: false | |
| }], | |
| legend: { | |
| enabled: false | |
| }, | |
| plotOptions: { | |
| series: { | |
| pointPlacement: 'between', | |
| states: { | |
| inactive: { | |
| enabled: false | |
| } | |
| } | |
| } | |
| }, | |
| series: [{ | |
| name: tooltipSeriesName[0], | |
| data: this.temperatures, | |
| type: 'spline', | |
| marker: { | |
| enabled: false, | |
| states: { | |
| hover: { | |
| enabled: true | |
| } | |
| } | |
| }, | |
| tooltip: { | |
| pointFormat: '<span style="color:{point.color}">\u25CF</span> ' + | |
| '{series.name}: <b>{point.y}°C</b><br/>' | |
| }, | |
| zIndex: 1, | |
| color: '#FF3333', | |
| negativeColor: '#48AFE8' | |
| }, { | |
| name: tooltipSeriesName[1], | |
| data: this.precipitationsError, | |
| type: 'column', | |
| color: 'url(#precipitation-error)', | |
| yAxis: 1, | |
| groupPadding: 0, | |
| pointPadding: 0, | |
| tooltip: { | |
| valueSuffix: ' mm', | |
| pointFormat: '<span style="color:{point.color}">\u25CF</span> ' + | |
| '{series.name}: <b>{point.minvalue} mm - {point.maxvalue} mm</b><br/>' | |
| }, | |
| grouping: false, | |
| dataLabels: { | |
| enabled: this.hasPrecipitationError, | |
| filter: { | |
| operator: '>', | |
| property: 'maxValue', | |
| value: 0 | |
| }, | |
| style: { | |
| fontSize: '8px', | |
| color: 'gray' | |
| } | |
| } | |
| }, { | |
| name: tooltipSeriesName[1], | |
| data: this.precipitations, | |
| type: 'column', | |
| color: '#68CFE8', | |
| yAxis: 1, | |
| groupPadding: 0, | |
| pointPadding: 0, | |
| grouping: false, | |
| dataLabels: { | |
| enabled: !this.hasPrecipitationError, | |
| filter: { | |
| operator: '>', | |
| property: 'y', | |
| value: 0 | |
| }, | |
| style: { | |
| fontSize: '8px', | |
| color: 'gray' | |
| } | |
| }, | |
| tooltip: { | |
| valueSuffix: ' mm' | |
| } | |
| }, { | |
| name: tooltipSeriesName[2], | |
| color: Highcharts.getOptions().colors[2], | |
| data: this.pressures, | |
| marker: { | |
| enabled: false | |
| }, | |
| shadow: false, | |
| tooltip: { | |
| valueSuffix: ' hPa' | |
| }, | |
| dashStyle: 'shortdot', | |
| yAxis: 2 | |
| }, { | |
| name: tooltipSeriesName[3], | |
| type: 'windbarb', | |
| id: 'windbarbs', | |
| color: '#db6600', | |
| lineWidth: 1.5, | |
| data: this.winds, | |
| vectorLength: 18, | |
| yOffset: -15, | |
| tooltip: { | |
| #if $unit.unit_type.windSpeed == 'km_per_hour' | |
| // Convert wind speed m/s to km/h in the tooltip | |
| valueDecimals: 4, | |
| pointFormatter: function() { | |
| return ( | |
| '<span style="color:' + this.series.color + '">\u25CF</span> ' | |
| + this.series.name + ': <b>' + Math.round(this.value * 3.6) + ' km/h</b> ' | |
| + '(' + this.beaufort + ')<br/>' | |
| ); | |
| } | |
| #elif $unit.unit_type.windSpeed == 'mile_per_hour' | |
| // Convert wind speed m/s to mph in the tooltip | |
| valueDecimals: 4, | |
| pointFormatter: function() { | |
| return ( | |
| '<span style="color:' + this.series.color + '">\u25CF</span> ' | |
| + this.series.name + ': <b>' + Math.round(this.value * 2.237) + ' mph</b> ' | |
| + '(' + this.beaufort + ')<br/>' | |
| ); | |
| } | |
| #elif $unit.unit_type.windSpeed == 'knot' | |
| // Convert wind speed m/s to knot in the tooltip | |
| valueDecimals: 4, | |
| pointFormatter: function() { | |
| return ( | |
| '<span style="color:' + this.series.color + '">\u25CF</span> ' | |
| + this.series.name + ': <b>' + Math.round(this.value * 1.94384) + ' knt</b> ' | |
| + '(' + this.beaufort + ')<br/>' | |
| ); | |
| } | |
| #else | |
| // Default | |
| valueSuffix: ' m/s' | |
| #end if | |
| } | |
| }] | |
| }; | |
| }; | |
| /** | |
| * Post-process the chart from the callback function, the second argument | |
| * Highcharts.Chart. | |
| */ | |
| Meteogram.prototype.onChartLoad = function (chart) { | |
| this.drawWeatherSymbols(chart); | |
| this.drawBlocksForWindArrows(chart); | |
| }; | |
| /** | |
| * Create the chart. This function is called async when the data file is loaded | |
| * and parsed. | |
| */ | |
| Meteogram.prototype.createChart = function () { | |
| this.chart = new Highcharts.Chart(this.getChartOptions(), chart => { | |
| this.onChartLoad(chart); | |
| }); | |
| }; | |
| Meteogram.prototype.error = function () { | |
| document.getElementById('loading').innerHTML = | |
| '<i class="fa fa-frown-o"></i> Failed loading data, please try again later'; | |
| }; | |
| /** | |
| * Handle the data. This part of the code is not Highcharts specific, but deals | |
| * with yr.no's specific data format | |
| */ | |
| Meteogram.prototype.parseYrData = function () { | |
| let pointStart; | |
| if (!this.json) { | |
| return this.error(); | |
| } | |
| // Loop over hourly (or 6-hourly) forecasts | |
| this.json.properties.timeseries.forEach((node, i) => { | |
| const x = Date.parse(node.time), | |
| nextHours = node.data.next_1_hours || node.data.next_6_hours, | |
| symbolCode = nextHours && nextHours.summary.symbol_code, | |
| to = node.data.next_1_hours ? x + 36e5 : x + 6 * 36e5; | |
| if (to > pointStart + 48 * 36e5) { | |
| return; | |
| } | |
| // Populate the parallel arrays | |
| this.symbols.push(nextHours.summary.symbol_code); | |
| this.temperatures.push({ | |
| x, | |
| y: node.data.instant.details.air_temperature, | |
| // custom options used in the tooltip formatter | |
| to, | |
| symbolName: Meteogram.dictionary[ | |
| symbolCode.replace(/_(day|night)$/, '') | |
| ].text | |
| }); | |
| this.precipitations.push({ | |
| x, | |
| y: nextHours.details.precipitation_amount | |
| }); | |
| if (i % 2 === 0) { | |
| this.winds.push({ | |
| x, | |
| value: node.data.instant.details.wind_speed, | |
| direction: node.data.instant.details.wind_from_direction | |
| }); | |
| } | |
| this.pressures.push({ | |
| x, | |
| y: node.data.instant.details.air_pressure_at_sea_level | |
| }); | |
| if (i === 0) { | |
| pointStart = (x + to) / 2; | |
| } | |
| }); | |
| // Create the chart when the data is loaded | |
| this.createChart(); | |
| }; | |
| // End of the Meteogram protype | |
| // On DOM ready... | |
| window.addEventListener("DOMContentLoaded", (event) => { | |
| Highcharts.ajax({ | |
| url, | |
| dataType: 'json', | |
| success: json => { | |
| window.meteogram = new Meteogram(json, 'meteogram-container'); | |
| }, | |
| error: Meteogram.prototype.error, | |
| headers: { | |
| // Override the Content-Type to avoid preflight problems with CORS | |
| 'Content-Type': 'text/plain' | |
| } | |
| }); | |
| }); | |
| </script> | |
| <style type="text/css"> | |
| #meteogram-container { | |
| min-width: 340px; | |
| max-width: 1100px; | |
| height: 310px; | |
| margin: 10px auto 10px auto; | |
| overflow-x: auto !important; | |
| } | |
| #meteogram-container .highcharts-text-outline { | |
| stroke: #ffffff; | |
| } | |
| .dark #meteogram-container .highcharts-point { | |
| stroke-width: 1.5px; | |
| } | |
| .dark #meteogram-container .highcharts-text-outline, | |
| .dark #meteogram-container .highcharts-yaxis-grid.dark-gridline path { | |
| stroke:transparent !important; | |
| } | |
| </style> |
Is possible convert wind units to Km/h?. I found this link where it says how to do it but not how to apply it.
Hi @dtalens this is my TODO LIST.
@dtalens see the last rev.
Thanks!!
Very nice and great work, thanks. Is there a way to convert the units from metric to imperial?
Hi @norecords, I intend to change the icons on my belchertown website for animated ones. And I would like to change them in the meteogram as well, so I would like the whole web to use the locally saved icons, I see I should change several javasescript functions but I don't know how to do it, could you help me? thanks.
@CaptainSteubing it could be done by a pointFormatter in the tooltip section like I do for windspeed, I put it in my TODO LIST.
@dtalens you mean Meteocons ? I have to look how they works and if it could be integrate to the meteogram.
Yes, I would like to change the icons to meteocons. Change belchertown js so that it takes the svg it will be done but inside the meteogram I don't know how to do it.
it could be done by a
pointFormatterin thetooltipsection like I do for windspeed, I put it in my TODO LIST.
OK, I'll have a look, thanks for pointing me in the right direction. Keep up the good work!
@CaptainSteubing After some tries you should convert data on this section
// Populate the parallel arrays
...
    y: node.data.instant.details.air_temperature,
...
to convert data from Celsius to Fahrenheit
y: Math.round((node.data.instant.details.air_temperature*9/5) + 32),
I'll work on it to be done from Weewx units
Thanks @norecords. I've made the adjustments as per your suggestion and got everything converted over to imperial. Adjusted the Tooltips accordingly.
I was having problems with the rounding since Math.round rounds to the nearest integer. I wanted to be able to round to a specific number of decimal places.
// Function to round off to specified number of places.

let roundToNoofPlaces = (number, numberplaces) => {
  const x = Math.pow(10,numberplaces);
  return Math.round(num * x) / x;
}
So in the above case I used:
y: roundToNoofPlaces(node.data.instant.details.air_temperature*9/5 + 32,2),
Digging into this is helping me develop an idea I am thinking about with for creating some gauge dashboards (via the hook include files) for the Belchertown Skin. If I can get my idea working, I'll be able to share it with the wider WeeWX community.
If anybody has trouble in making the above function work, try this one: -
 function round(number, precision) {
'use strict';
precision = precision ? +precision : 0;

var sNumber     = number + '',
    periodIndex = sNumber.indexOf('.'),
    factor      = Math.pow(10, precision);

if (periodIndex === -1 || precision < 0) {
    return Math.round(number * factor) / factor;
}

number = +number;

// sNumber[periodIndex + precision + 1] is the last digit
if (sNumber[periodIndex + precision + 1] >= 5) {
    // Correcting float error
    // factor * 10 to use one decimal place beyond the precision
    number += (number < 0 ? -1 : 1) / (factor * 10);
}

return +number.toFixed(precision);
}
use it like this: -
y: round((node.data.instant.details.air_temperature*9/5 + 32),2),
Yes, I would like to change the icons to meteocons. Change belchertown js so that it takes the svg it will be done but inside the meteogram I don't know how to do it.
Has anyone succeded in converting the icons to Meteocons yet? I would be interested to know as I have had very mixed results myself. Meteocons are running on my main page very happily and not so with the meteogram
I have now achieved this and it is quite straightfoward.
UPDATED
Rather than hack the original code, the simplest way is to re-name the Meteocons to match the name of the YR icon.
For example for the YR weather code 'clearsky_day': -
change the Meteocon file name 'clear-day.svg' to '01d.svg'
Once you have completed the re-naming of the Meteocon files you must make a change to the location of the icons. At line 252 in the code you will find this section: -
  if (Meteogram.dictionary[symbol]) {
    chart.renderer
      .image(
        'https://cdn.jsdelivr.net/gh/nrkno/yr-weather-symbols' +
          `@8.0.1/dist/svg/` + icon + `.svg`,
        point.plotX + chart.plotLeft - 8,
        point.plotY + chart.plotTop - 35,
        30,
        30
      )
You will need to change this to the location of where you have stored the re-named Meteocon files on your own server. In my case it looks like this: -
  if (Meteogram.dictionary[symbol]) {
    chart.renderer
      .image(
        `img/meteocons/` + icon + `.svg`,
        point.plotX + chart.plotLeft - 8,
        point.plotY + chart.plotTop - 30,
        30,
        30
      )

      I have this running now on my local server. I will post the link once I move it up to my public server.

      Ian
Thanks @steepleian
I have created a set of Meteocons mapped to the YR weather symbol file names. You can download them here: -
https://github.com/steepleian/MeteoconsYR/archive/refs/heads/meteoconsYR.zip
@steepleian just saw that you also change icons for weather34. Thanks for your share Ian
I have been using the meteocons on my test server for a few months now. I am writing a new template as a successor to weewx-Weather34. I had been trying out many designs including some of my own. I thought it would be cool to see how they look on Weather34 as well. If you go to https://claydonsweather.org.uk/weewx/divumdev you can see them in use on the meteogram as well (link is under the forecast module). The units switching is also working very well on the meteogram. You can toggle the units from the menu (under the hamburger button top left).
Ian
@steepleian You have some issues on your meteogram, first don't convert wind speed with node.data.instant.details otherwise windbarbs will be wrong.
km/h

mph

They have to stay in m/s. Look at the tooltip section
        pointFormatter: function() {
          return (
            '<span style="color:' + this.series.color + '">\u25CF</span> '
            + this.series.name + ': <b>' + Math.round(this.value * 3.6) + ' km/h</b> '
            + '(' + this.beaufort + ')<br/>'
          );
        }
second, icons aren't same size from yr.no to meteocon set, so you have to increase the position to not glue the line.
point.plotY + chart.plotTop - 35,

Finally if you resize the browser window windbarbs are redrawn but not at the right place, to avoid this you have to fix the size of the chart and have an overflow on X in case the window is smaller

#meteogram-container {
  min-width: 340px;
  max-width: 1100px;
  height: 310px;
  margin: 10px auto 10px auto;
  overflow-x: auto !important;
}
Hi,
Thank you for these points.
The first one, I had not actually appreciated that the barbs themselves need to stay in m/s. I have now made your suggested change.


The top one is m/s and the bottom one is mph, so that is fixed thank you.
Regarding the browser issues, I had actually tried overflow-x from your original CSS and the behaviour is similar to what it is with my CSS settings, the barbs shift to the left when the browser is re-sized. I have not worked out yet what else is happening to cause the shift. I have left the code set with overflow-x so that you can see.
Your fix for the icon size difference has solved the effects I had been seeing across different browsers, so thank you for that solution as well.
Ian
I forgot to tell you something, you have to set the width of the container also
Meteogram.prototype.getChartOptions = function () {
  return {
    chart: {
      renderTo: this.container,
      marginBottom: 70,
      marginRight: 40,
      marginTop: 50,
      plotBorderWidth: 1,
      width: 1100,
      height: 310,
      alignTicks: false
    },

...
combined with the css rules
#meteogram-container {
  min-width: 340px;
  max-width: 1100px;
  height: 310px;
  margin: 10px auto 10px auto;
  overflow-x: auto !important;
}
That has fixed it, big thank you :-)
Ei, today in my meteogram rain numbers appear as shown in this image:
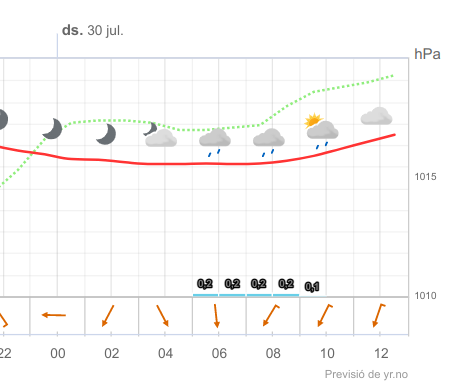
Is this normal?
@dtalens that have been fixed on the last rev https://gist.github.com/norecords/85ea0186497404618574a7c62202f304/revisions#diff-ec09dffc558368608407d7edb446419b262fad1a433a261cc29c60f34783df12
That because of new Highcharts version.
Add that to your css rules:
#meteogram-container .highcharts-text-outline {
  stroke: #ffffff;
}
Also
in // Top X axis section
at line 402 change
y: -5
to
y: 5
@Millardiang @steepleian you can load your Meteocon icon set like that:
replace
      if (Meteogram.dictionary[symbol]) {
        chart.renderer
          .image(
            'https://cdn.jsdelivr.net/gh/nrkno/yr-weather-symbols' +
              `@8.0.1/dist/svg/` + icon + `.svg`,
            point.plotX + chart.plotLeft - 8,
            point.plotY + chart.plotTop - 35,
            30,
            30
          )
by
      if (Meteogram.dictionary[symbol]) {
        chart.renderer
          .image(
            'https://cdn.jsdelivr.net/gh/steepleian/MeteoconsYR@master/' + icon + '.svg',
            point.plotX + chart.plotLeft - 8,
            point.plotY + chart.plotTop - 40,
            35,
            35
          )
that way you use external geo localized cdn from jsdelivr :)
you forgot to edit this line with your latitude, longitude and altitude
// Edit next line with your latitude, longitude and altitude
const url = 'https://api.met.no/weatherapi/locationforecast/2.0/compact?lat=43.487&lon=6.079&altitude=164';
on your meteogram you use mine...
you forgot to edit this line with your latitude, longitude and altitude
// Edit next line with your latitude, longitude and altitude
const url = 'https://api.met.no/weatherapi/locationforecast/2.0/compact?lat=43.487&lon=6.079&altitude=164';
on your meteogram you use mine...
Uppss thnaks @norecords
Thanks @norecords. I'll try it!