-
-
Save norecords/85ea0186497404618574a7c62202f304 to your computer and use it in GitHub Desktop.
| <!-- | |
| * | |
| * Highcharts Meteogram for Belchertown skin and Weewx. | |
| * Working with Highstock.js, Dark mode and forecast translations from skin.conf | |
| * Download source code at https://gist.github.com/norecords/85ea0186497404618574a7c62202f304 | |
| * | |
| --> | |
| <div id="meteogram-container"></div> | |
| <script src="https://code.highcharts.com/modules/windbarb.js"></script> | |
| <script src="https://code.highcharts.com/modules/pattern-fill.js"></script> | |
| <script type="text/javascript"> | |
| /** | |
| * From https://www.highcharts.com/demo/combo-meteogram | |
| * This is what it does: | |
| * | |
| * - Loads weather forecast from www.yr.no in form of a JSON service. | |
| * - When the data arrives async, a Meteogram instance is created. We have | |
| * created the Meteogram prototype to provide an organized structure of the | |
| * different methods and subroutines associated with the demo. | |
| * - The parseYrData method parses the data from www.yr.no into several parallel | |
| * arrays. These arrays are used directly as the data option for temperature, | |
| * precipitation and air pressure. | |
| * - After this, the options structure is built, and the chart generated with | |
| * the parsed data. | |
| * - On chart load, weather icons and the frames for the wind arrows are | |
| * rendered using custom logic. | |
| */ | |
| // Edit next line with your latitude, longitude and altitude | |
| const url = 'https://api.met.no/weatherapi/locationforecast/2.0/compact?lat=43.487&lon=6.079&altitude=164'; | |
| // Edit the chart title | |
| const chartText = 'Météogramme pour Correns, France'; | |
| // Edit next line to translate series name in the tooltip | |
| const tooltipSeriesName = ["Temperature", "Precipitation", "Air pressure", "Wind"]; | |
| function Meteogram(json, container) { | |
| // Parallel arrays for the chart data, these are populated as the JSON file | |
| // is loaded | |
| this.symbols = []; | |
| this.precipitations = []; | |
| this.precipitationsError = []; // Only for some data sets | |
| this.winds = []; | |
| this.temperatures = []; | |
| this.pressures = []; | |
| // Initialize | |
| this.json = json; | |
| this.container = container; | |
| // Run | |
| this.parseYrData(); | |
| } | |
| /** | |
| * Mapping of the symbol code in yr.no's API to the icons in their public | |
| * GitHub repo, as well as the text used in the tooltip. | |
| * | |
| * https://api.met.no/weatherapi/weathericon/2.0/documentation | |
| */ | |
| Meteogram.dictionary = { | |
| clearsky: { | |
| symbol: '01', | |
| text: '$obs.label.forecast_cloud_code_CL' | |
| }, | |
| fair: { | |
| symbol: '02', | |
| text: '$obs.label.forecast_cloud_code_FW' | |
| }, | |
| partlycloudy: { | |
| symbol: '03', | |
| text: '$obs.label.forecast_cloud_code_SC' | |
| }, | |
| cloudy: { | |
| symbol: '04', | |
| text: '$obs.label.forecast_cloud_code_OV' | |
| }, | |
| lightrainshowers: { | |
| symbol: '40', | |
| text: '$obs.label.forecast_intensity_code_L $obs.label.forecast_weather_code_RW' | |
| }, | |
| rainshowers: { | |
| symbol: '05', | |
| text: '$obs.label.forecast_weather_code_RW' | |
| }, | |
| heavyrainshowers: { | |
| symbol: '41', | |
| text: '$obs.label.forecast_intensity_code_H $obs.label.forecast_weather_code_RW' | |
| }, | |
| lightrainshowersandthunder: { | |
| symbol: '24', | |
| text: '$obs.label.forecast_intensity_code_L $obs.label.forecast_weather_code_RW / $obs.label.forecast_weather_code_T' | |
| }, | |
| rainshowersandthunder: { | |
| symbol: '06', | |
| text: '$obs.label.forecast_weather_code_RW / $obs.label.forecast_weather_code_T' | |
| }, | |
| heavyrainshowersandthunder: { | |
| symbol: '25', | |
| text: '$obs.label.forecast_intensity_code_H $obs.label.forecast_weather_code_RW / $obs.label.forecast_weather_code_T' | |
| }, | |
| lightsleetshowers: { | |
| symbol: '42', | |
| text: '$obs.label.forecast_intensity_code_L $obs.label.forecast_weather_code_IP' | |
| }, | |
| sleetshowers: { | |
| symbol: '07', | |
| text: '$obs.label.forecast_weather_code_IP' | |
| }, | |
| heavysleetshowers: { | |
| symbol: '43', | |
| text: '$obs.label.forecast_intensity_code_H $obs.label.forecast_weather_code_IP' | |
| }, | |
| lightsleetshowersandthunder: { | |
| symbol: '26', | |
| text: '$obs.label.forecast_intensity_code_L $obs.label.forecast_weather_code_IP $obs.label.forecast_weather_code_T' | |
| }, | |
| sleetshowersandthunder: { | |
| symbol: '20', | |
| text: '$obs.label.forecast_weather_code_IP / $obs.label.forecast_weather_code_T' | |
| }, | |
| heavysleetshowersandthunder: { | |
| symbol: '27', | |
| text: '$obs.label.forecast_intensity_code_H $obs.label.forecast_weather_code_IP / $obs.label.forecast_weather_code_T' | |
| }, | |
| lightsnowshowers: { | |
| symbol: '44', | |
| text: '$obs.label.forecast_intensity_code_L $obs.label.forecast_weather_code_SW' | |
| }, | |
| snowshowers: { | |
| symbol: '08', | |
| text: '$obs.label.forecast_weather_code_SW' | |
| }, | |
| heavysnowshowers: { | |
| symbol: '45', | |
| text: '$obs.label.forecast_intensity_code_H $obs.label.forecast_weather_code_SW' | |
| }, | |
| lightsnowshowersandthunder: { | |
| symbol: '28', | |
| text: '$obs.label.forecast_intensity_code_L $obs.label.forecast_weather_code_SW / $obs.label.forecast_weather_code_T' | |
| }, | |
| snowshowersandthunder: { | |
| symbol: '21', | |
| text: '$obs.label.forecast_weather_code_SW / $obs.label.forecast_weather_code_T' | |
| }, | |
| heavysnowshowersandthunder: { | |
| symbol: '29', | |
| text: '$obs.label.forecast_intensity_code_H $obs.label.forecast_weather_code_SW / $obs.label.forecast_weather_code_T' | |
| }, | |
| lightrain: { | |
| symbol: '46', | |
| text: '$obs.label.forecast_intensity_code_L $obs.label.forecast_weather_code_R' | |
| }, | |
| rain: { | |
| symbol: '09', | |
| text: '$obs.label.forecast_weather_code_R' | |
| }, | |
| heavyrain: { | |
| symbol: '10', | |
| text: '$obs.label.forecast_intensity_code_H $obs.label.forecast_weather_code_R' | |
| }, | |
| lightrainandthunder: { | |
| symbol: '30', | |
| text: '$obs.label.forecast_intensity_code_L $obs.label.forecast_weather_code_R / $obs.label.forecast_weather_code_T' | |
| }, | |
| rainandthunder: { | |
| symbol: '22', | |
| text: '$obs.label.forecast_weather_code_R / $obs.label.forecast_weather_code_T' | |
| }, | |
| heavyrainandthunder: { | |
| symbol: '11', | |
| text: '$obs.label.forecast_intensity_code_H $obs.label.forecast_weather_code_R / $obs.label.forecast_weather_code_T' | |
| }, | |
| lightsleet: { | |
| symbol: '47', | |
| text: '$obs.label.forecast_intensity_code_L $obs.label.forecast_weather_code_IP' | |
| }, | |
| sleet: { | |
| symbol: '12', | |
| text: '$obs.label.forecast_weather_code_IP' | |
| }, | |
| heavysleet: { | |
| symbol: '48', | |
| text: '$obs.label.forecast_intensity_code_H $obs.label.forecast_weather_code_IP' | |
| }, | |
| lightsleetandthunder: { | |
| symbol: '31', | |
| text: '$obs.label.forecast_intensity_code_L $obs.label.forecast_weather_code_IP / $obs.label.forecast_weather_code_T' | |
| }, | |
| sleetandthunder: { | |
| symbol: '23', | |
| text: '$obs.label.forecast_weather_code_IP / $obs.label.forecast_weather_code_T' | |
| }, | |
| heavysleetandthunder: { | |
| symbol: '32', | |
| text: '$obs.label.forecast_intensity_code_H $obs.label.forecast_weather_code_IP / $obs.label.forecast_weather_code_T' | |
| }, | |
| lightsnow: { | |
| symbol: '49', | |
| text: '$obs.label.forecast_intensity_code_L $obs.label.forecast_weather_code_S' | |
| }, | |
| snow: { | |
| symbol: '13', | |
| text: '$obs.label.forecast_weather_code_S' | |
| }, | |
| heavysnow: { | |
| symbol: '50', | |
| text: '$obs.label.forecast_intensity_code_H $obs.label.forecast_weather_code_S' | |
| }, | |
| lightsnowandthunder: { | |
| symbol: '33', | |
| text: '$obs.label.forecast_intensity_code_L $obs.label.forecast_weather_code_S / $obs.label.forecast_weather_code_T' | |
| }, | |
| snowandthunder: { | |
| symbol: '14', | |
| text: '$obs.label.forecast_weather_code_S / $obs.label.forecast_weather_code_T' | |
| }, | |
| heavysnowandthunder: { | |
| symbol: '34', | |
| text: '$obs.label.forecast_intensity_code_H $obs.label.forecast_weather_code_S / $obs.label.forecast_weather_code_T' | |
| }, | |
| fog: { | |
| symbol: '15', | |
| text: '$obs.label.forecast_weather_code_F' | |
| } | |
| }; | |
| /** | |
| * Translate beaufort names | |
| */ | |
| Highcharts.seriesTypes.windbarb.prototype.beaufortName = ["$beaufort0", "$beaufort1", "$beaufort2", "$beaufort3", | |
| "$beaufort4", "$beaufort5", "$beaufort6", "$beaufort7", "$beaufort9", "$beaufort10","$beaufort11", "$beaufort12"]; | |
| /** | |
| * Draw the weather symbols on top of the temperature series. The symbols are | |
| * fetched from yr.no's MIT licensed weather symbol collection. | |
| * https://github.com/YR/weather-symbols | |
| */ | |
| Meteogram.prototype.drawWeatherSymbols = function (chart) { | |
| chart.series[0].data.forEach((point, i) => { | |
| if (this.resolution > 36e5 || i % 2 === 0) { | |
| const [symbol, specifier] = this.symbols[i].split('_'), | |
| icon = Meteogram.dictionary[symbol].symbol + | |
| ({ day: 'd', night: 'n' }[specifier] || ''); | |
| if (Meteogram.dictionary[symbol]) { | |
| chart.renderer | |
| .image( | |
| 'https://cdn.jsdelivr.net/gh/nrkno/yr-weather-symbols' + | |
| `@8.0.1/dist/svg/` + icon + `.svg`, | |
| point.plotX + chart.plotLeft - 8, | |
| point.plotY + chart.plotTop - 35, | |
| 30, | |
| 30 | |
| ) | |
| .attr({ | |
| zIndex: 5 | |
| }) | |
| .add(); | |
| } else { | |
| console.log(symbol); | |
| } | |
| } | |
| }); | |
| }; | |
| /** | |
| * Draw blocks around wind arrows, below the plot area | |
| */ | |
| Meteogram.prototype.drawBlocksForWindArrows = function (chart) { | |
| const xAxis = chart.xAxis[0]; | |
| for ( | |
| let pos = xAxis.min, max = xAxis.max, i = 0; | |
| pos <= max + 36e5; pos += 36e5, | |
| i += 1 | |
| ) { | |
| // Get the X position | |
| const isLast = pos === max + 36e5, | |
| x = Math.round(xAxis.toPixels(pos)) + (isLast ? 0.5 : -0.5); | |
| // Draw the vertical dividers and ticks | |
| const isLong = this.resolution > 36e5 ? | |
| pos % this.resolution === 0 : | |
| i % 2 === 0; | |
| chart.renderer | |
| .path([ | |
| 'M', x, chart.plotTop + chart.plotHeight + (isLong ? 0 : 28), | |
| 'L', x, chart.plotTop + chart.plotHeight + 32, | |
| 'Z' | |
| ]) | |
| .attr({ | |
| stroke: chart.options.chart.plotBorderColor, | |
| 'stroke-width': 1 | |
| }) | |
| .add(); | |
| } | |
| // Center items in block | |
| chart.get('windbarbs').markerGroup.attr({ | |
| translateX: chart.get('windbarbs').markerGroup.translateX + 8 | |
| }); | |
| }; | |
| /** | |
| * Build and return the Highcharts options structure | |
| */ | |
| Meteogram.prototype.getChartOptions = function () { | |
| return { | |
| chart: { | |
| renderTo: this.container, | |
| marginBottom: 70, | |
| marginRight: 40, | |
| marginTop: 50, | |
| plotBorderWidth: 1, | |
| width: 1100, | |
| height: 310, | |
| alignTicks: false | |
| }, | |
| defs: { | |
| patterns: [{ | |
| id: 'precipitation-error', | |
| path: { | |
| d: [ | |
| 'M', 3.3, 0, 'L', -6.7, 10, | |
| 'M', 6.7, 0, 'L', -3.3, 10, | |
| 'M', 10, 0, 'L', 0, 10, | |
| 'M', 13.3, 0, 'L', 3.3, 10, | |
| 'M', 16.7, 0, 'L', 6.7, 10 | |
| ].join(' '), | |
| stroke: '#68CFE8', | |
| strokeWidth: 1 | |
| } | |
| }] | |
| }, | |
| title: { | |
| text: chartText, | |
| align: 'left', | |
| style: { | |
| whiteSpace: 'nowrap', | |
| textOverflow: 'ellipsis' | |
| } | |
| }, | |
| credits: { | |
| text: 'Forecast from <a href="https://yr.no">yr.no</a>', | |
| href: 'https://yr.no', | |
| position: { | |
| x: -40 | |
| } | |
| }, | |
| tooltip: { | |
| shared: true, | |
| useHTML: true, | |
| headerFormat: | |
| '<small>{point.x:%A %e %b, %H:%M} - {point.to:%H:%M}</small><br>' + | |
| '<b>{point.symbolName}</b><br>' | |
| }, | |
| exporting: { | |
| enabled: false | |
| }, | |
| xAxis: [{ // Bottom X axis | |
| type: 'datetime', | |
| tickInterval: 2 * 36e5, // two hours | |
| minorTickInterval: 36e5, // one hour | |
| tickLength: 0, | |
| gridLineWidth: 1, | |
| gridLineColor: 'rgba(128, 128, 128, 0.1)', | |
| startOnTick: false, | |
| endOnTick: false, | |
| minPadding: 0, | |
| maxPadding: 0, | |
| offset: 30, | |
| showLastLabel: true, | |
| labels: { | |
| format: '{value:%H}' | |
| }, | |
| crosshair: true | |
| }, { // Top X axis | |
| linkedTo: 0, | |
| type: 'datetime', | |
| tickInterval: 24 * 3600 * 1000, | |
| labels: { | |
| format: '{value:<span style="font-size: 12px; font-weight: bold">%a</span> %e %b}', | |
| align: 'left', | |
| x: 3, | |
| y: 5 | |
| }, | |
| opposite: true, | |
| tickLength: 20, | |
| gridLineWidth: 1 | |
| }], | |
| yAxis: [{ // temperature axis | |
| title: { | |
| text: '$unit.label.outTemp', | |
| offset: 0, | |
| align: 'high', | |
| rotation: 0, | |
| style: { | |
| fontSize: '12px', | |
| }, | |
| textAlign: 'left', | |
| x: -17, | |
| y: 2 | |
| }, | |
| labels: { | |
| style: { | |
| fontSize: '10px' | |
| }, | |
| x: -5 | |
| }, | |
| plotLines: [{ // zero plane | |
| value: 0, | |
| color: '#BBBBBB', | |
| width: 1, | |
| zIndex: 3 | |
| }], | |
| maxPadding: 0.3, | |
| minRange: 8, | |
| tickInterval: 1, | |
| gridLineColor: 'rgba(128, 128, 128, 0.1)', | |
| showLastLabel: false | |
| }, { // precipitation axis | |
| title: { | |
| text: null | |
| }, | |
| labels: { | |
| enabled: false | |
| }, | |
| className: 'dark-gridline', | |
| gridLineWidth: 0, | |
| tickLength: 0, | |
| minRange: 10, | |
| min: 0 | |
| }, { // Air pressure | |
| allowDecimals: false, | |
| title: { // Title on top of axis | |
| text: 'hPa', | |
| offset: 0, | |
| align: 'high', | |
| rotation: 0, | |
| style: { | |
| fontSize: '12px', | |
| }, | |
| textAlign: 'left', | |
| x: 5 | |
| }, | |
| labels: { | |
| style: { | |
| fontSize: '8px', | |
| }, | |
| y: 2, | |
| x: 5 | |
| }, | |
| className: 'dark-gridline', | |
| gridLineWidth: 0, | |
| opposite: true, | |
| showLastLabel: false | |
| }], | |
| legend: { | |
| enabled: false | |
| }, | |
| plotOptions: { | |
| series: { | |
| pointPlacement: 'between', | |
| states: { | |
| inactive: { | |
| enabled: false | |
| } | |
| } | |
| } | |
| }, | |
| series: [{ | |
| name: tooltipSeriesName[0], | |
| data: this.temperatures, | |
| type: 'spline', | |
| marker: { | |
| enabled: false, | |
| states: { | |
| hover: { | |
| enabled: true | |
| } | |
| } | |
| }, | |
| tooltip: { | |
| pointFormat: '<span style="color:{point.color}">\u25CF</span> ' + | |
| '{series.name}: <b>{point.y}°C</b><br/>' | |
| }, | |
| zIndex: 1, | |
| color: '#FF3333', | |
| negativeColor: '#48AFE8' | |
| }, { | |
| name: tooltipSeriesName[1], | |
| data: this.precipitationsError, | |
| type: 'column', | |
| color: 'url(#precipitation-error)', | |
| yAxis: 1, | |
| groupPadding: 0, | |
| pointPadding: 0, | |
| tooltip: { | |
| valueSuffix: ' mm', | |
| pointFormat: '<span style="color:{point.color}">\u25CF</span> ' + | |
| '{series.name}: <b>{point.minvalue} mm - {point.maxvalue} mm</b><br/>' | |
| }, | |
| grouping: false, | |
| dataLabels: { | |
| enabled: this.hasPrecipitationError, | |
| filter: { | |
| operator: '>', | |
| property: 'maxValue', | |
| value: 0 | |
| }, | |
| style: { | |
| fontSize: '8px', | |
| color: 'gray' | |
| } | |
| } | |
| }, { | |
| name: tooltipSeriesName[1], | |
| data: this.precipitations, | |
| type: 'column', | |
| color: '#68CFE8', | |
| yAxis: 1, | |
| groupPadding: 0, | |
| pointPadding: 0, | |
| grouping: false, | |
| dataLabels: { | |
| enabled: !this.hasPrecipitationError, | |
| filter: { | |
| operator: '>', | |
| property: 'y', | |
| value: 0 | |
| }, | |
| style: { | |
| fontSize: '8px', | |
| color: 'gray' | |
| } | |
| }, | |
| tooltip: { | |
| valueSuffix: ' mm' | |
| } | |
| }, { | |
| name: tooltipSeriesName[2], | |
| color: Highcharts.getOptions().colors[2], | |
| data: this.pressures, | |
| marker: { | |
| enabled: false | |
| }, | |
| shadow: false, | |
| tooltip: { | |
| valueSuffix: ' hPa' | |
| }, | |
| dashStyle: 'shortdot', | |
| yAxis: 2 | |
| }, { | |
| name: tooltipSeriesName[3], | |
| type: 'windbarb', | |
| id: 'windbarbs', | |
| color: '#db6600', | |
| lineWidth: 1.5, | |
| data: this.winds, | |
| vectorLength: 18, | |
| yOffset: -15, | |
| tooltip: { | |
| #if $unit.unit_type.windSpeed == 'km_per_hour' | |
| // Convert wind speed m/s to km/h in the tooltip | |
| valueDecimals: 4, | |
| pointFormatter: function() { | |
| return ( | |
| '<span style="color:' + this.series.color + '">\u25CF</span> ' | |
| + this.series.name + ': <b>' + Math.round(this.value * 3.6) + ' km/h</b> ' | |
| + '(' + this.beaufort + ')<br/>' | |
| ); | |
| } | |
| #elif $unit.unit_type.windSpeed == 'mile_per_hour' | |
| // Convert wind speed m/s to mph in the tooltip | |
| valueDecimals: 4, | |
| pointFormatter: function() { | |
| return ( | |
| '<span style="color:' + this.series.color + '">\u25CF</span> ' | |
| + this.series.name + ': <b>' + Math.round(this.value * 2.237) + ' mph</b> ' | |
| + '(' + this.beaufort + ')<br/>' | |
| ); | |
| } | |
| #elif $unit.unit_type.windSpeed == 'knot' | |
| // Convert wind speed m/s to knot in the tooltip | |
| valueDecimals: 4, | |
| pointFormatter: function() { | |
| return ( | |
| '<span style="color:' + this.series.color + '">\u25CF</span> ' | |
| + this.series.name + ': <b>' + Math.round(this.value * 1.94384) + ' knt</b> ' | |
| + '(' + this.beaufort + ')<br/>' | |
| ); | |
| } | |
| #else | |
| // Default | |
| valueSuffix: ' m/s' | |
| #end if | |
| } | |
| }] | |
| }; | |
| }; | |
| /** | |
| * Post-process the chart from the callback function, the second argument | |
| * Highcharts.Chart. | |
| */ | |
| Meteogram.prototype.onChartLoad = function (chart) { | |
| this.drawWeatherSymbols(chart); | |
| this.drawBlocksForWindArrows(chart); | |
| }; | |
| /** | |
| * Create the chart. This function is called async when the data file is loaded | |
| * and parsed. | |
| */ | |
| Meteogram.prototype.createChart = function () { | |
| this.chart = new Highcharts.Chart(this.getChartOptions(), chart => { | |
| this.onChartLoad(chart); | |
| }); | |
| }; | |
| Meteogram.prototype.error = function () { | |
| document.getElementById('loading').innerHTML = | |
| '<i class="fa fa-frown-o"></i> Failed loading data, please try again later'; | |
| }; | |
| /** | |
| * Handle the data. This part of the code is not Highcharts specific, but deals | |
| * with yr.no's specific data format | |
| */ | |
| Meteogram.prototype.parseYrData = function () { | |
| let pointStart; | |
| if (!this.json) { | |
| return this.error(); | |
| } | |
| // Loop over hourly (or 6-hourly) forecasts | |
| this.json.properties.timeseries.forEach((node, i) => { | |
| const x = Date.parse(node.time), | |
| nextHours = node.data.next_1_hours || node.data.next_6_hours, | |
| symbolCode = nextHours && nextHours.summary.symbol_code, | |
| to = node.data.next_1_hours ? x + 36e5 : x + 6 * 36e5; | |
| if (to > pointStart + 48 * 36e5) { | |
| return; | |
| } | |
| // Populate the parallel arrays | |
| this.symbols.push(nextHours.summary.symbol_code); | |
| this.temperatures.push({ | |
| x, | |
| y: node.data.instant.details.air_temperature, | |
| // custom options used in the tooltip formatter | |
| to, | |
| symbolName: Meteogram.dictionary[ | |
| symbolCode.replace(/_(day|night)$/, '') | |
| ].text | |
| }); | |
| this.precipitations.push({ | |
| x, | |
| y: nextHours.details.precipitation_amount | |
| }); | |
| if (i % 2 === 0) { | |
| this.winds.push({ | |
| x, | |
| value: node.data.instant.details.wind_speed, | |
| direction: node.data.instant.details.wind_from_direction | |
| }); | |
| } | |
| this.pressures.push({ | |
| x, | |
| y: node.data.instant.details.air_pressure_at_sea_level | |
| }); | |
| if (i === 0) { | |
| pointStart = (x + to) / 2; | |
| } | |
| }); | |
| // Create the chart when the data is loaded | |
| this.createChart(); | |
| }; | |
| // End of the Meteogram protype | |
| // On DOM ready... | |
| window.addEventListener("DOMContentLoaded", (event) => { | |
| Highcharts.ajax({ | |
| url, | |
| dataType: 'json', | |
| success: json => { | |
| window.meteogram = new Meteogram(json, 'meteogram-container'); | |
| }, | |
| error: Meteogram.prototype.error, | |
| headers: { | |
| // Override the Content-Type to avoid preflight problems with CORS | |
| 'Content-Type': 'text/plain' | |
| } | |
| }); | |
| }); | |
| </script> | |
| <style type="text/css"> | |
| #meteogram-container { | |
| min-width: 340px; | |
| max-width: 1100px; | |
| height: 310px; | |
| margin: 10px auto 10px auto; | |
| overflow-x: auto !important; | |
| } | |
| #meteogram-container .highcharts-text-outline { | |
| stroke: #ffffff; | |
| } | |
| .dark #meteogram-container .highcharts-point { | |
| stroke-width: 1.5px; | |
| } | |
| .dark #meteogram-container .highcharts-text-outline, | |
| .dark #meteogram-container .highcharts-yaxis-grid.dark-gridline path { | |
| stroke:transparent !important; | |
| } | |
| </style> |
I forgot to tell you something, you have to set the width of the container also
Meteogram.prototype.getChartOptions = function () {
  return {
    chart: {
      renderTo: this.container,
      marginBottom: 70,
      marginRight: 40,
      marginTop: 50,
      plotBorderWidth: 1,
      width: 1100,
      height: 310,
      alignTicks: false
    },

...
combined with the css rules
#meteogram-container {
  min-width: 340px;
  max-width: 1100px;
  height: 310px;
  margin: 10px auto 10px auto;
  overflow-x: auto !important;
}
That has fixed it, big thank you :-)
Ei, today in my meteogram rain numbers appear as shown in this image:
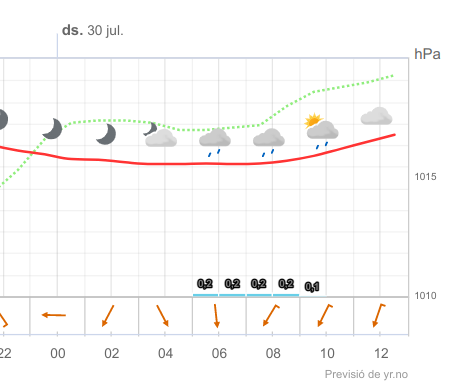
Is this normal?
@dtalens that have been fixed on the last rev https://gist.github.com/norecords/85ea0186497404618574a7c62202f304/revisions#diff-ec09dffc558368608407d7edb446419b262fad1a433a261cc29c60f34783df12
That because of new Highcharts version.
Add that to your css rules:
#meteogram-container .highcharts-text-outline {
  stroke: #ffffff;
}
Also
in // Top X axis section
at line 402 change
y: -5
to
y: 5
@Millardiang @steepleian you can load your Meteocon icon set like that:
replace
      if (Meteogram.dictionary[symbol]) {
        chart.renderer
          .image(
            'https://cdn.jsdelivr.net/gh/nrkno/yr-weather-symbols' +
              `@8.0.1/dist/svg/` + icon + `.svg`,
            point.plotX + chart.plotLeft - 8,
            point.plotY + chart.plotTop - 35,
            30,
            30
          )
by
      if (Meteogram.dictionary[symbol]) {
        chart.renderer
          .image(
            'https://cdn.jsdelivr.net/gh/steepleian/MeteoconsYR@master/' + icon + '.svg',
            point.plotX + chart.plotLeft - 8,
            point.plotY + chart.plotTop - 40,
            35,
            35
          )
that way you use external geo localized cdn from jsdelivr :)
you forgot to edit this line with your latitude, longitude and altitude
// Edit next line with your latitude, longitude and altitude
const url = 'https://api.met.no/weatherapi/locationforecast/2.0/compact?lat=43.487&lon=6.079&altitude=164';
on your meteogram you use mine...
you forgot to edit this line with your latitude, longitude and altitude
// Edit next line with your latitude, longitude and altitude
const url = 'https://api.met.no/weatherapi/locationforecast/2.0/compact?lat=43.487&lon=6.079&altitude=164';
on your meteogram you use mine...
Uppss thnaks @norecords
Hi,
Thank you for these points.
The first one, I had not actually appreciated that the barbs themselves need to stay in m/s. I have now made your suggested change.
The top one is m/s and the bottom one is mph, so that is fixed thank you.
Regarding the browser issues, I had actually tried overflow-x from your original CSS and the behaviour is similar to what it is with my CSS settings, the barbs shift to the left when the browser is re-sized. I have not worked out yet what else is happening to cause the shift. I have left the code set with overflow-x so that you can see.
Your fix for the icon size difference has solved the effects I had been seeing across different browsers, so thank you for that solution as well.
Ian