Over the past couple of years, I have turned into a really cycling fan. Not just the Flanders Classics, but many of the international UCI World Tour races can grab my attention for hours on end - silly as that may be!
Now, the Tour de France 2016 is coming to an end. I have written a couple of blog posts about some graphiness in the Tour data over here:
Central to the blogpost was the ability to use a number of Neo4j Awesome Apocs for the import and queries, but of course we can do a number of things as well without them. So let’s explore
I had to of course start from the information on the Sporza Tour website (hosted by a local TV station in Belgium), and convert that into a google sheet with all the data. Once I had that, I could add the data pretty easily with this model:
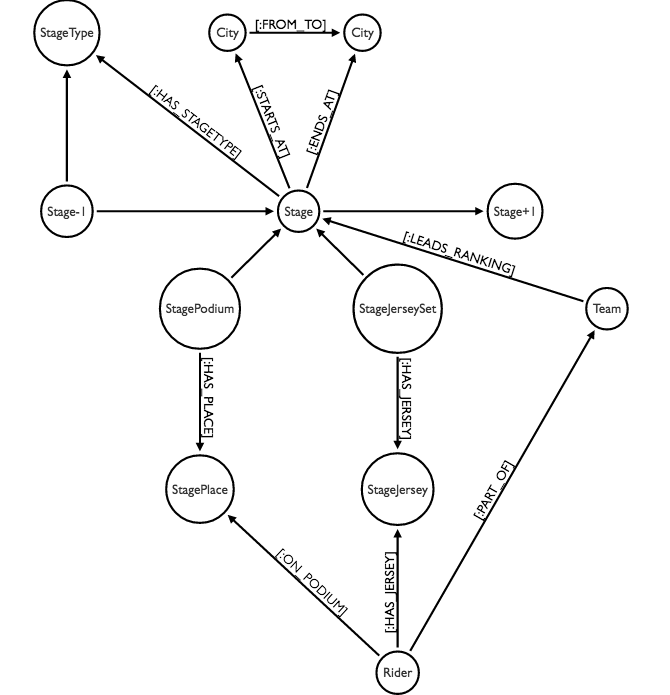
Very simple - but it’s so much nicer when you can make it interactive and load it into Neo4j. Let’s do that. Let’s load that data into this graphgist.
Let’s set up the graph with some
-
stagetypes: flat, mountain, timetrial, or a combination of types…
-
stages: 21 in total - we will connect them all together too
-
stage podiums: every stage has a podium associated with it
-
stage podium places: 1,2 and 3
-
stage jersey-sets:
-
yellow: the overall leader in the race
-
green: the "points" leader, which is typically the sprinters' jersey-sets
-
red polka-dot: the best climber in the race
-
white/youth: the best under 26 year old in the race
-
Before we start: please note that that this page does a bunch of queries in the background, and may take a while to load completely. Please be gentle :) …
So here we go - let’s do the initial setup:
load csv with headers from  "https://docs.google.com/spreadsheets/d/1kD9JwoR2MzEVyq5YV1HX3eeV2k98FJ69A10ZxQDj01Q/export?format=csv&id=1kD9JwoR2MzEVyq5YV1HX3eeV2k98FJ69A10ZxQDj01Q&gid=0" as csv
with csv, split(csv.Type,", ") as Realtype
unwind Realtype as Rtype
merge (st:StageType {name: Rtype})
with csv
create (s:Stage {seq: toInt(csv.Stage), date: csv.Date, distance: toInt(csv.Distance)})-[:HAS_PODIUM]->(p:StagePodium {name:"Stage "+csv.Stage+" Podium"})-[:HAS_PLACE]->(:StagePlace {value:1})
create (p)-[:HAS_PLACE]->(:StagePlace {value:2})
create (p)-[:HAS_PLACE]->(:StagePlace {value:3})
create (s)-[:HAS_JERSEYSET]->(sjs:StageJerseySet {name:"Stage "+csv.Stage+" Jersey Set"})-[:HAS_JERSEY]->(:StageJersey {name:"Yellow"})
create (sjs)-[:HAS_JERSEY]->(:StageJersey {name:"Green"})
create (sjs)-[:HAS_JERSEY]->(:StageJersey {name:"Mountain"})
create (sjs)-[:HAS_JERSEY]->(:StageJersey {name:"Youth"})
Let’s see what we have then:
Now we can add more stuff to it.
load csv with headers from  "https://docs.google.com/spreadsheets/d/1kD9JwoR2MzEVyq5YV1HX3eeV2k98FJ69A10ZxQDj01Q/export?format=csv&id=1kD9JwoR2MzEVyq5YV1HX3eeV2k98FJ69A10ZxQDj01Q&gid=0" as csv
merge (from:City {name: csv.From})
merge (to:City {name: csv.To})
with csv
match (from:City {name: csv.From}),  (to:City {name: csv.To}), (s:Stage)
where s.seq = toInt(csv.Stage)
merge (from)<-[:STARTS_AT]-(s)-[:ENDS_AT]->(to)
merge (from)-[:FROM_TO]->(to)
with csv
with split(csv.Type,", ") as Realtype, toInt(csv.Stage) as StageSeq
unwind Realtype as Rtype
match (st:StageType {name: Rtype}), (s:Stage {seq: StageSeq})
merge (st)<-[:HAS_TYPE]-(s);
And then we can connect the different stages too:
match (s1:Stage), (s2:Stage)
where s1.seq=s2.seq+1
merge (s2)-[:PRECEDES]->(s1);
Now let’s see what we have by looking at one particular stage and exploring the area around it:
match (s:Stage)
with s as stage
limit 1
match (stage)-[r*..2]-(n)
return stage, r, n;
and visualize it with a subgraph:
Now we can start adding the riders and teams to the dataset. Here’s how we do that:
load csv with headers from "https://docs.google.com/spreadsheets/d/1kD9JwoR2MzEVyq5YV1HX3eeV2k98FJ69A10ZxQDj01Q/export?format=csv&id=1kD9JwoR2MzEVyq5YV1HX3eeV2k98FJ69A10ZxQDj01Q&gid=1612867267" as csv
merge (t:Team {name: csv.Team})
merge (r:Rider {id: toInt(csv.ID), fullname: csv.`Full Name`, firstname: csv.`First Name`, lastname: csv.`Last Name`})-[:PART_OF_TEAM]->(t);
And then we can look at a couple or riders and their teams:
match (t:Team)
with t
limit 3
match (t)--(r:Rider)
return t, r;
Which gives us this result:
Now, in the dataset/google sheet, I have also added some of the key result data for each and everyone of the stages. So let’s add that to the graph as well - starting with the stage podium for every stage:
load csv with headers from  "https://docs.google.com/spreadsheets/d/1kD9JwoR2MzEVyq5YV1HX3eeV2k98FJ69A10ZxQDj01Q/export?format=csv&id=1kD9JwoR2MzEVyq5YV1HX3eeV2k98FJ69A10ZxQDj01Q&gid=0" as csv
match (s:Stage {seq: toInt(csv.Stage)})--(p:StagePodium)--(sp:StagePlace {value:1}), (r:Rider {fullname: csv.Stage1st})
merge (r)-[:ON_PODIUM]->(sp)
with csv
match (s:Stage {seq: toInt(csv.Stage)})--(p:StagePodium)--(sp:StagePlace {value:2}), (r:Rider {fullname: csv.Stage2nd})
merge (r)-[:ON_PODIUM]->(sp)
with csv
match (s:Stage {seq: toInt(csv.Stage)})--(p:StagePodium)--(sp:StagePlace {value:3}),(r:Rider {fullname: csv.Stage3rd})
merge (r)-[:ON_PODIUM]->(sp);
We can also add the different jerseys as they are given after every stage, and add those:
load csv with headers from  "https://docs.google.com/spreadsheets/d/1kD9JwoR2MzEVyq5YV1HX3eeV2k98FJ69A10ZxQDj01Q/export?format=csv&id=1kD9JwoR2MzEVyq5YV1HX3eeV2k98FJ69A10ZxQDj01Q&gid=0" as csv
match (s:Stage {seq: toInt(csv.Stage)})--(sjs:StageJerseySet)--(sj:StageJersey {name:"Yellow"}), (r:Rider {fullname: csv.Yellow})
merge (r)-[:HAS_JERSEY]->(sj)
with csv
match (s:Stage {seq: toInt(csv.Stage)})--(sjs:StageJerseySet)--(sj:StageJersey {name:"Green"}), (r:Rider {fullname: csv.Green})
merge (r)-[:HAS_JERSEY]->(sj)
with csv
match (s:Stage {seq: toInt(csv.Stage)})--(sjs:StageJerseySet)--(sj:StageJersey {name:"Youth"}), (r:Rider {fullname: csv.Youth})
merge (r)-[:HAS_JERSEY]->(sj)
with csv
match (s:Stage {seq: toInt(csv.Stage)})--(sjs:StageJerseySet)--(sj:StageJersey {name:"Mountain"}), (r:Rider {fullname: csv.Mountain})
merge (r)-[:HAS_JERSEY]->(sj);
and then we can look at the podium and jersey sets for a particular stage:
match (s:Stage)
with s
limit 1
match path = ((r2:Rider)--(spl:StagePlace)--(spo:StagePodium)--(s)--(sjs:StageJerseySet)--(sj:StageJersey)--(r1:Rider))
return path;
And display the result:
In the Tour the France, there’s also something called a "team ranking" after every stage. So let’s add that to the graph:
load csv with headers from  "https://docs.google.com/spreadsheets/d/1kD9JwoR2MzEVyq5YV1HX3eeV2k98FJ69A10ZxQDj01Q/export?format=csv&id=1kD9JwoR2MzEVyq5YV1HX3eeV2k98FJ69A10ZxQDj01Q&gid=0" as csv
match (s:Stage {seq: toInt(csv.Stage)}),(team:Team {name: csv.Teams})
merge (team)-[:LEADS_RANKING]->(s);
And let’s take a look at the team ranking after every stage:
match (s:Stage)-[:LEADS_RANKING]-(t:Team)
return distinct s.date, s.seq, t.name
order by s.seq asc;
which gives:
There are so many other things that we could look at, especially if we start using some of the awesome apocs that you can add to your own Neo4j server. Other things you can think of are ready to be explored in the console below. Enjoy!
I hope this gist was interesting for you, and that we will see each other soon.
This gist was created by Rik Van Bruggen