When a chart is created by using EmbeddedChartBuilder of Spreadsheet service, the title of vAxis which is put by setOption("vAxis", {title: "y axis"}) doesn't work. It is considered that this is a bug. Because I have confirmed that this had worked fine. Ref But this specification had been changed. So I would like to introduce the method for adding the title of vAxis when a chart is created using Google Apps Script.
This is a sample script using EmbeddedChartBuilder of Spreadsheet service.
function chartSample1() {
  var sheet = SpreadsheetApp.getActiveSheet();
  var chart = sheet.newChart()
    .setChartType(Charts.ChartType.LINE)
    .asLineChart()
    .setOption("useFirstColumnAsDomain", true)
    .addRange(sheet.getRange("A1:A21"))
    .addRange(sheet.getRange("B1:B21"))
    .addRange(sheet.getRange("C1:C21"))
    .setNumHeaders(1)
    .setPosition(5, 5, 0, 0)
    .setOption("title", "Sample chart 1")
    .setOption("hAxis", {title: "x axis"})
    .setOption("vAxis", {title: "y axis"})
    .setOption("legend", {position: "top"})
    .build();
  sheet.insertChart(chart);
}
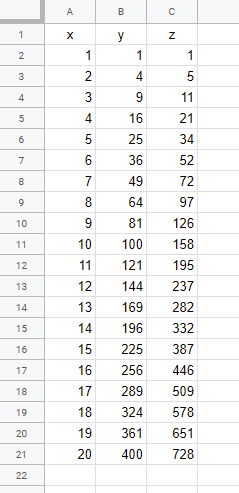
When this script is run, the above chart is created. You can see that the chart has no title at vAxis, although setOption("vAxis", {title: "y axis"}) is used. I think that this is a bug.
This is a sample script using EmbeddedChartBuilder of Spreadsheet service. When I had tested various patterns, I noticed a solution. In this solution, it modifies the sample script 1 as follows.
setOption("vAxis", {title: "y axis"})setOption("vAxes", {0: {title: "y axis"}})When series is set using setOption(), I used setOption("series", {0: {type: "line", color: "red"}, 0: {...}}). From this, I could notice above modification. You can see the official document at here. Please check "vAxes" of "Configuration Options".
function chartSample1() {
  var sheet = SpreadsheetApp.getActiveSheet();
  var chart = sheet.newChart()
    .setChartType(Charts.ChartType.LINE)
    .asLineChart()
    .setOption("useFirstColumnAsDomain", true)
    .addRange(sheet.getRange("A1:A21"))
    .addRange(sheet.getRange("B1:B21"))
    .addRange(sheet.getRange("C1:C21"))
    .setNumHeaders(1)
    .setPosition(5, 5, 0, 0)
    .setOption("title", "Sample chart 1")
    .setOption("hAxis", {title: "x axis"})
    .setOption("vAxes", {0: {title: "y axis"}}) // Modified
    .setOption("legend", {position: "top"})
    .build();
  sheet.insertChart(chart);
}
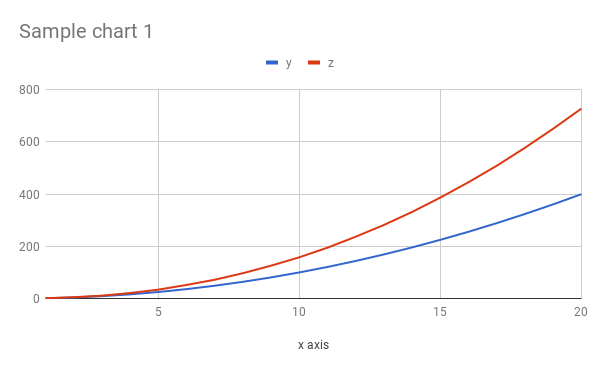
When this script is run, the above chart is created. You can see that the chart has a title at vAxis.
This is a sample script using the addChart method of Sheets API is used. Of course, you can create the same chart using Sheets API. When this is used, the process cost can be reduced from the above method.
When you use this script, please enable Sheets API at Advanced Google Services and API console. You can see about how to enable Sheets API at here.
function chartSample2() {
  var spec = {
    "title": "Sample chart 2",
    "basicChart": {
      "chartType": "LINE",
      "legendPosition": "TOP_LEGEND",
      "axis": [
        {"position": "BOTTOM_AXIS", "title": "x axis"},
        {"position": "LEFT_AXIS", "title": "y axis"},
      ],
      "domains": [{"domain": {"sourceRange": {"sources": [{"startRowIndex": 0, "endRowIndex": 21, "startColumnIndex": 0, "endColumnIndex": 1}]}}}],
      "series": [
        {
          "series": {"sourceRange": {"sources": [{"startRowIndex": 0, "endRowIndex": 21, "startColumnIndex": 1, "endColumnIndex": 2}]}},
          "targetAxis": "LEFT_AXIS",
        },
       {
          "series": {"sourceRange": {"sources": [{"startRowIndex": 0, "endRowIndex": 21, "startColumnIndex": 2, "endColumnIndex": 3}]}},
          "targetAxis": "LEFT_AXIS",
        },
      ],
      "headerCount": 1,
    },
    "hiddenDimensionStrategy": "SKIP_HIDDEN_ROWS",
  };
  var position = {"overlayPosition": {"anchorCell": {"rowIndex": 4, "columnIndex": 4}}};
  var id = SpreadsheetApp.getActiveSpreadsheet().getId();
  Sheets.Spreadsheets.batchUpdate({requests: [{addChart: {chart: {spec: spec, position: position}}}]}, id);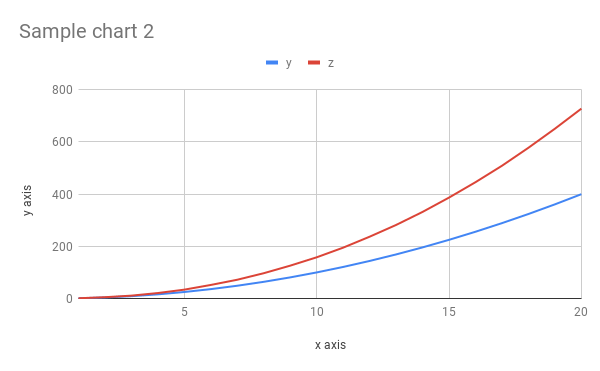
}When this script is run, the above chart is created. You can see that the chart has a title at vAxis.
If this was useful for your situation, I'm glad.
Thank you for sample script 2! It seems as if the only working way to set
vAxisoptions is through setting them using thevAxesas you describe in:setOption("vAxes", {0: {title: "y axis"}})I was going insane!!I took the liberty to link to this fix here: https://stackoverflow.com/questions/52894553/google-apps-script-chart-vaxis-title-not-working/58139095#58139095