This is a sample script for converting a range in Google Spreadsheet as an image data using Google Apps Script. Unfortunately, there are no methods for directly converting the range in Google Spreadsheet as an image data in the built-in functions. So in this case, as a workaround, Charts Service is used.
const range = "B5:D10";
const [header, ...values] = SpreadsheetApp.getActiveSheet()
  .getRange(range)
  .getDisplayValues();
const table = Charts.newDataTable();
header.forEach((e) => table.addColumn(Charts.ColumnType.STRING, e));
values.forEach((e) => table.addRow(e));
const blob = Charts.newTableChart()
  .setDataTable(table.build())
  .setDimensions(500, 500)
  .setOption("alternatingRowStyle", false)
  .build()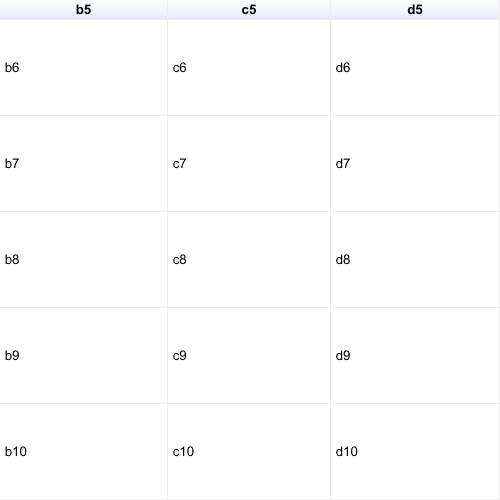
.getBlob();- In this sample script, the range of "B5:D10" of the active sheet is converted to an image data which is PNG format.
When above blob is saved as a PNG file, the following result is obtained.
- Charts Service
- How to copy a range from a spreadsheet as an image to Google Slides?
- This sample script was answered for this question in stackoverflow.
Will this have the data range formatting available?