Last active
July 6, 2021 13:49
-
-
Save teddokano/acd9a66b150f545ab01aa51edc87000c to your computer and use it in GitHub Desktop.
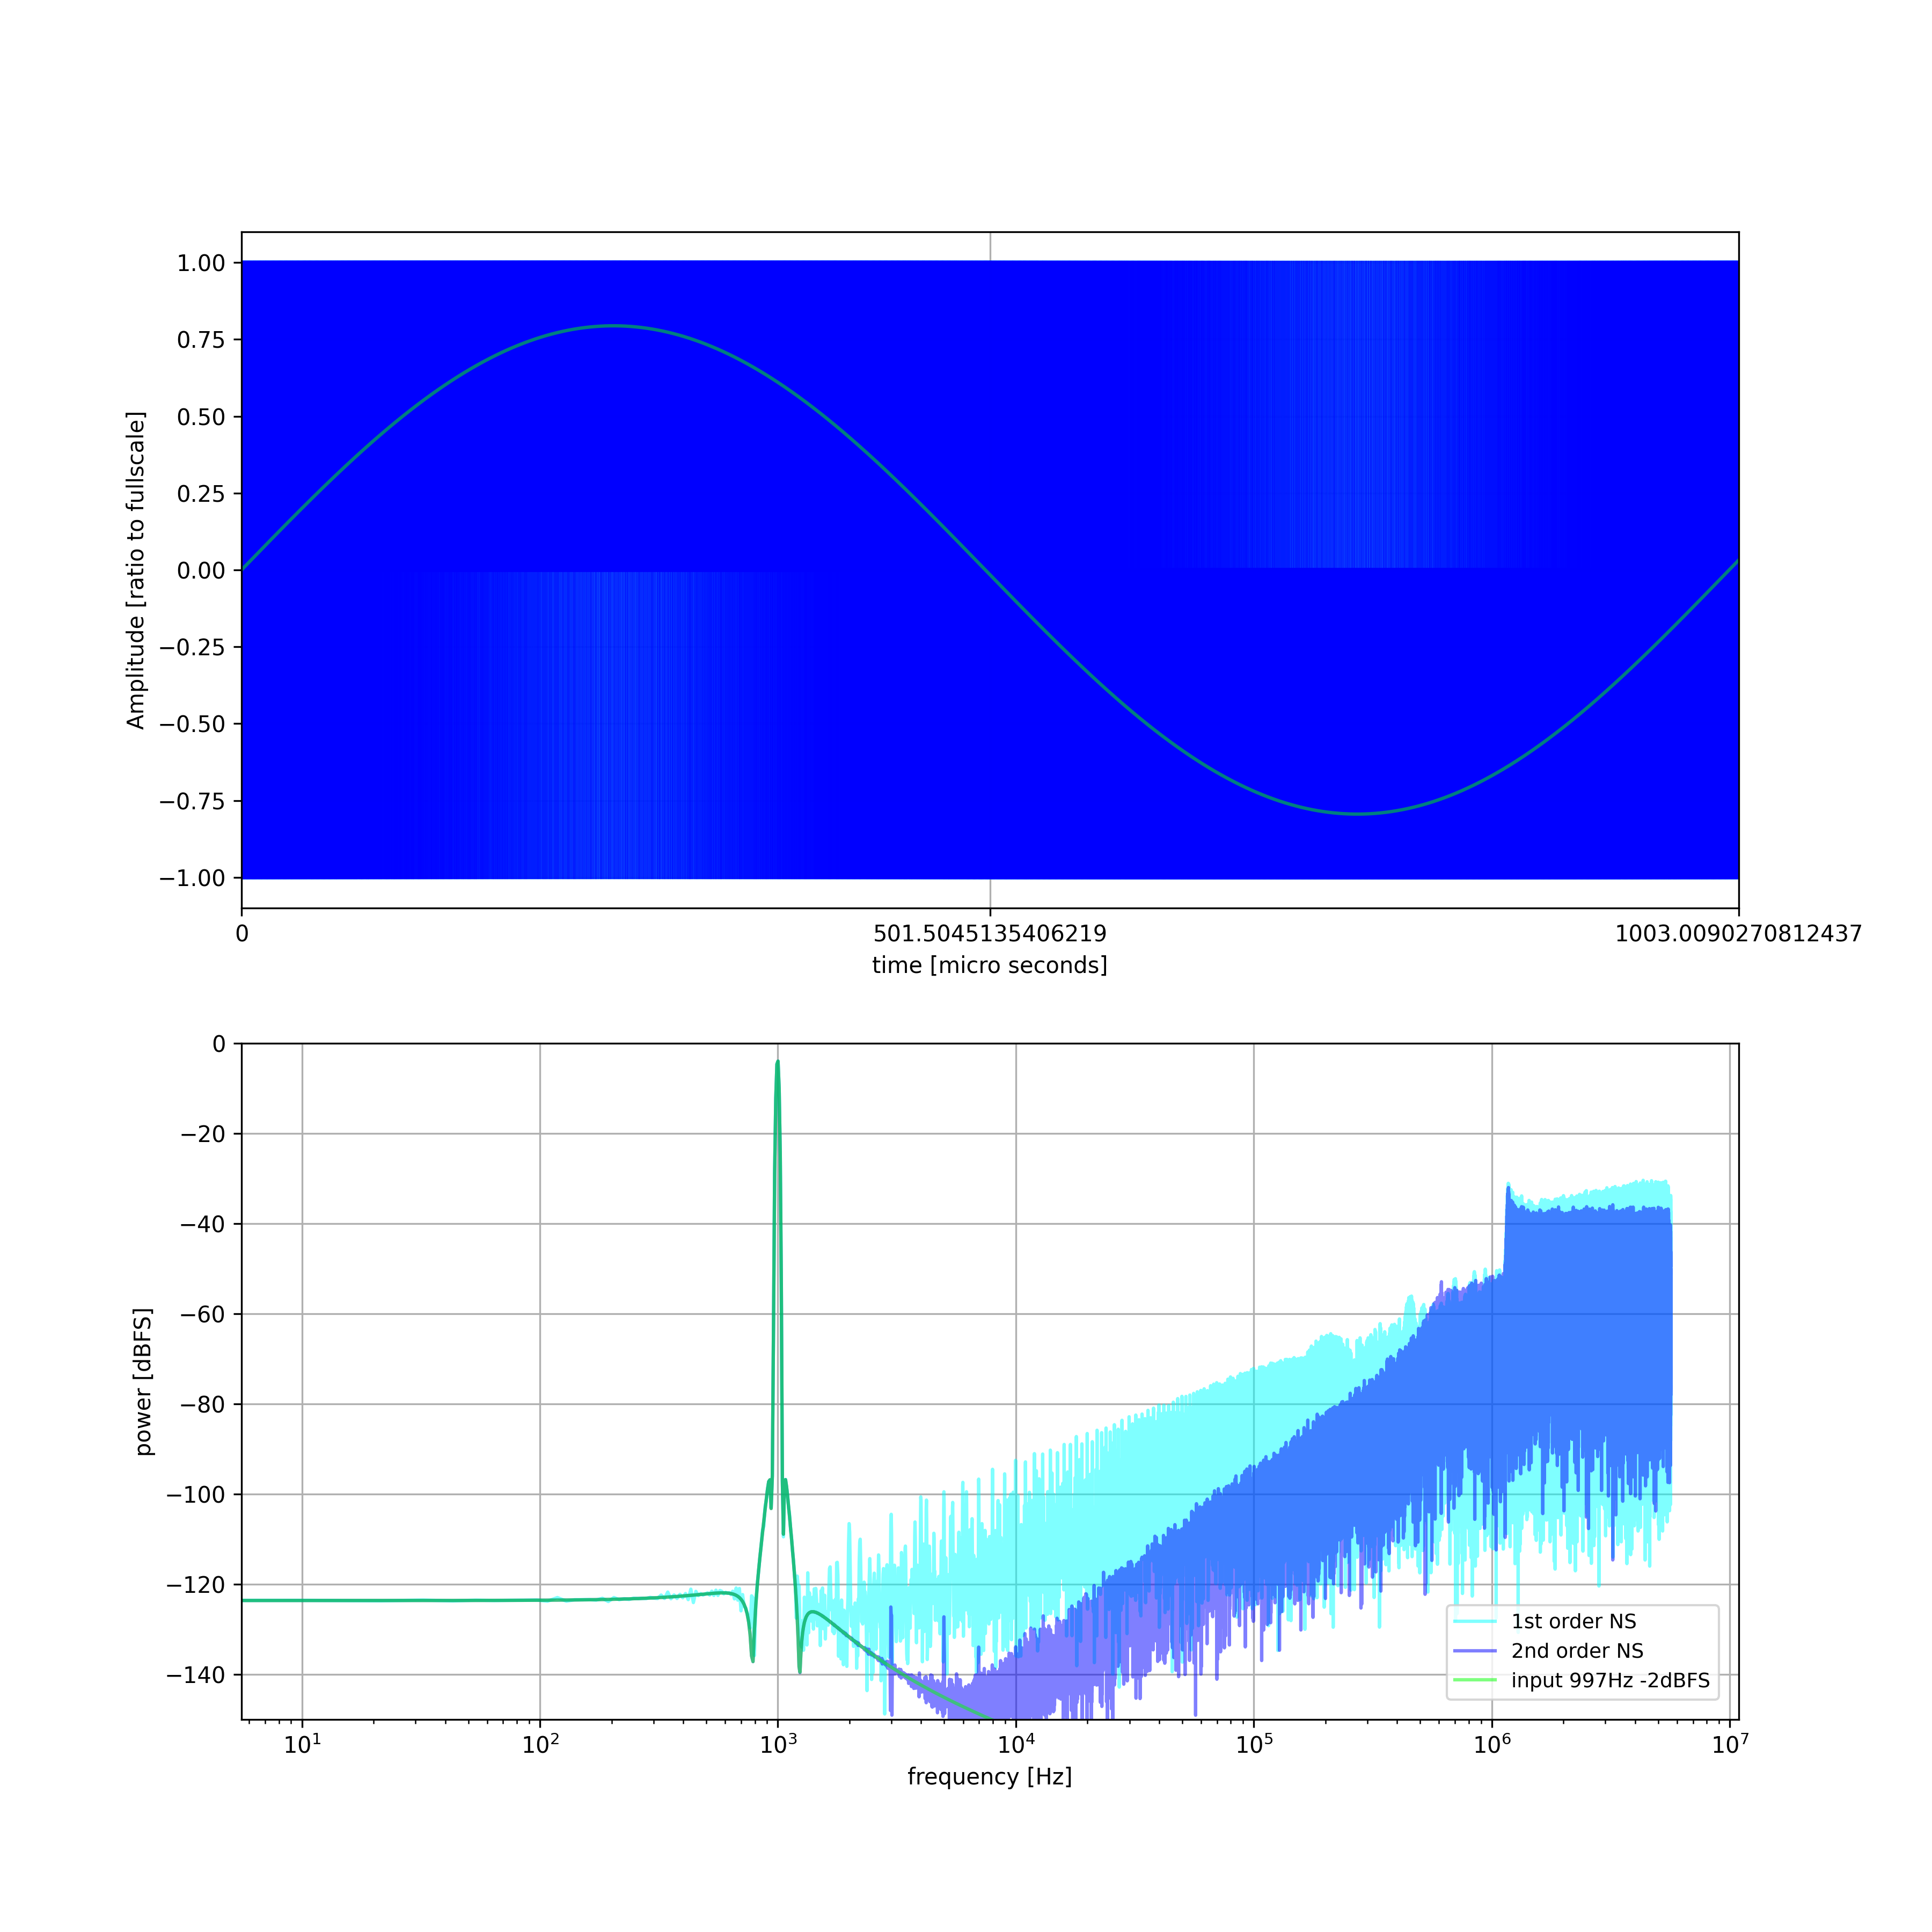
1bit quantizer with 1st and 2nd order noiseshaper: time/frequency domain plot by python
This file contains bidirectional Unicode text that may be interpreted or compiled differently than what appears below. To review, open the file in an editor that reveals hidden Unicode characters.
Learn more about bidirectional Unicode characters
| #!/usr/bin/env python3 | |
| # 1st and 2nd order noise shaper time/frequency domain plot by python | |
| # | |
| # Tedd OKANO, Tsukimidai Communications Syndicate 2021 | |
| # Version 1.1 06-July-2021 | |
| # | |
| # code converted from https://gist.github.com/teddokano/17c53e6da8c4b5cb8e70 | |
| # about "noiseshaper": https://bit.ly/3p3ehLP | |
| # Copyright (c) 2021 Tedd OKANO | |
| # Released under the MIT license | |
| # https://opensource.org/licenses/mit-license.php | |
| import matplotlib.pyplot as plt | |
| import numpy as np | |
| from scipy import signal | |
| from scipy import signal | |
| from scipy.fft import rfft, rfftfreq | |
| import functools | |
| print = functools.partial( print, flush = True ) | |
| N = 2**20 # number of samples | |
| FS = 44100 # Hz | |
| OSR = 256 # oversampling rate | |
| SIG_FREQ = 997 # Hz | |
| ATTENUATION = 2 # dB (0dB = Fullscale) | |
| OSRFS = (FS * OSR) | |
| CYCLE = SIG_FREQ * (N / OSRFS) | |
| AMPLITUDE = 10 ** (-ATTENUATION / 20) | |
| WINDOW = "blackmanharris" | |
| COLOR_IN = { "color": [ 0, 1, 0 ], "alpha": 0.5, "label": "input {}Hz -{}dBFS".format( SIG_FREQ, ATTENUATION ) } | |
| COLOR_FS1 = { "color": [ 0, 1, 1 ], "alpha": 0.5, "label": "1st order NS" } | |
| COLOR_FS2 = { "color": [ 0, 0, 1 ], "alpha": 0.5, "label": "2nd order NS" } | |
| def noise_shaper_1st_order( s ): | |
| pulse = [] | |
| noise = 0 | |
| for i in range( len( s ) ): | |
| qin = s[ i ] - noise | |
| if 0 < qin: | |
| out = 1 | |
| else: | |
| out = -1 | |
| noise = out - qin | |
| pulse.append( out ) | |
| return pulse | |
| def noise_shaper_2nd_order( s ): | |
| pulse = [] | |
| noise = 0 | |
| d1 = 0 | |
| d2 = 0 | |
| for i in range( len( s ) ): | |
| if 0 < d2: | |
| out = 1 | |
| else: | |
| out = -1 | |
| noise = out - d2 | |
| d2 = d1 - noise * 2 | |
| d1 = s[ i ] + noise | |
| pulse.append( out ) | |
| return pulse | |
| def power_spectrum( dat ): | |
| dat = np.abs( dat ) ** 2 | |
| dat /= ( len( dat ) ** 2 ) | |
| dat *= wc | |
| dat[ 1 : -1 ] *= 2 | |
| return dat | |
| if __name__ == "__main__": | |
| x = np.linspace( 0, 2 * np.pi, N ) | |
| s = np.sin( x * CYCLE ) | |
| s *= AMPLITUDE | |
| p1 = noise_shaper_1st_order( s ) | |
| p2 = noise_shaper_2nd_order( s ) | |
| w = signal.get_window( WINDOW, len( s ) ) | |
| wc = len( s ) / sum( w ) | |
| ps0 = rfft( s * w ) | |
| ps1 = rfft( p1 * w ) | |
| ps2 = rfft( p2 * w ) | |
| rfft_freq = rfftfreq( len( s ), d = 1.0 / OSRFS ) | |
| ps0 = power_spectrum( ps0 ) | |
| ps1 = power_spectrum( ps1 ) | |
| ps2 = power_spectrum( ps2 ) | |
| ps0 = [ 10 * np.log10( x ) for x in ps0 ] | |
| ps1 = [ 10 * np.log10( x ) for x in ps1 ] | |
| ps2 = [ 10 * np.log10( x ) for x in ps2 ] | |
| fig = plt.figure(figsize=(12, 12)) | |
| ax = fig.add_subplot(211) | |
| bx = fig.add_subplot(212) | |
| bx.set_ylim( [ -150, 0 ] ) | |
| one_cycle = N // int( CYCLE ) | |
| print( "plotting.. ", end = "" ) | |
| for i in range( one_cycle ): | |
| ax.plot( [ x[ i ], x[ i ] ], [ 0, p1[ i ]], **COLOR_FS1 ) | |
| for i in range( one_cycle ): | |
| ax.plot( [ x[ i ], x[ i ] ], [ 0, p2[ i ]], **COLOR_FS2 ) | |
| ax.plot( x[ 0 : one_cycle ], s[ 0 : one_cycle ], **COLOR_IN ) | |
| bx.semilogx( rfft_freq, ps1, **COLOR_FS1 ) | |
| bx.semilogx( rfft_freq, ps2, **COLOR_FS2 ) | |
| bx.semilogx( rfft_freq, ps0 , **COLOR_IN ) | |
| bx.legend( loc='lower right', borderaxespad=1, fontsize=9 ) | |
| one_cycle_time = one_cycle * 2 * np.pi / N | |
| ax.set_xlim( [0, one_cycle_time] ) | |
| ax.set_xticks( [0, one_cycle_time / 2, one_cycle_time] ) | |
| ax.set_xticklabels( [ 0, 1e6 * (1.0 / SIG_FREQ) / 2.0, 1e6 * 1.0 / SIG_FREQ] ) | |
| ax.set_xlabel( "time [micro seconds]" ) | |
| ax.set_ylabel( "Amplitude [ratio to fullscale]" ) | |
| bx.set_xlabel( "frequency [Hz]" ) | |
| bx.set_ylabel( "power [dBFS]" ) | |
| ax.grid() | |
| bx.grid() | |
| print( "done" ) | |
| print( "saving file.. ", end = "" ) | |
| plt.savefig( "noiseshaper.png", dpi=300 ) | |
| print( "done" ) | |
| plt.show() |
Sign up for free
to join this conversation on GitHub.
Already have an account?
Sign in to comment
output file sample