Created
April 9, 2020 07:56
-
-
Save thomasaarholt/851928553f434d08dcb95846006fe1bd to your computer and use it in GitHub Desktop.
Strange behaviour with parallel map and UnivariateSpline
This file contains bidirectional Unicode text that may be interpreted or compiled differently than what appears below. To review, open the file in an editor that reveals hidden Unicode characters.
Learn more about bidirectional Unicode characters
| import numpy as np | |
| import matplotlib.pyplot as plt | |
| import scipy.interpolate | |
| from concurrent.futures import ThreadPoolExecutor | |
| from os import cpu_count | |
| executor = ThreadPoolExecutor(max_workers=cpu_count()) | |
| print(f"Processors available: {cpu_count()}") | |
| # parallel=True uses the following map function | |
| parallel_map = executor.map | |
| regular_map = map | |
| samples, length = 30, 2000 | |
| x = np.linspace(0, np.pi/2, length) | |
| data1 = np.repeat(np.sin(x)[None, :], samples, axis=0) # data used for parallel = True | |
| data2 = data1.copy() # data used for parallel = False | |
| data3 = data1.copy() # sanity check checking parallel = False shows same value again | |
| def func(d): | |
| spline = scipy.interpolate.UnivariateSpline(x, d) | |
| return spline(x) | |
| parallel = list(parallel_map(func, data1)) | |
| regular = list(regular_map(func, data2)) | |
| sanity = list(regular_map(func, data3)) | |
| fig, (ax1, ax2, ax3) = plt.subplots(ncols=3, figsize=(9,3)) | |
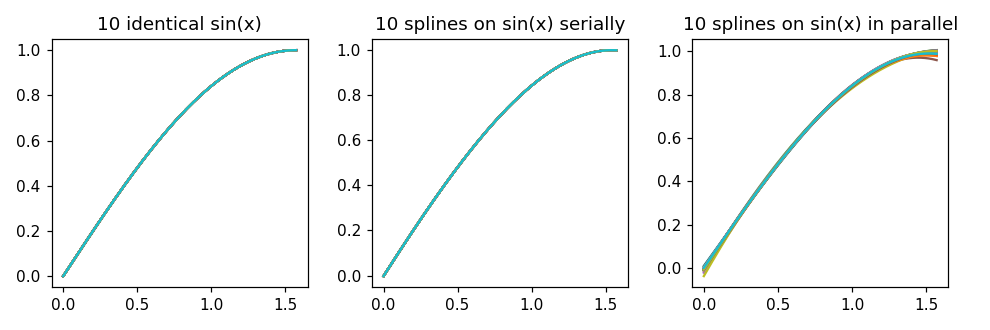
| ax1.set_title('10 identical sin(x)') | |
| ax2.set_title('10 splines on sin(x) serially') | |
| ax3.set_title('10 splines on sin(x) in parallel') | |
| for i in range(samples): | |
| ax1.plot(x, data1[i]) | |
| ax2.plot(x, regular[i]) | |
| ax3.plot(x, parallel[i]) |
Sign up for free
to join this conversation on GitHub.
Already have an account?
Sign in to comment
The above results in the following plot. Note that the right hand plot (parallel) is not identical to the middle one (serial).